

If you find this article interesting, click the like button for me! I would greatly appreciate it :)

Homes are often the most expensive and, by extension, most important purchase of people’s lives. Over the last 50 years, they’ve largely been viewed as an investment class, in addition to a means of shelter. A steady bond bull market (lower interest rates) has helped to encourage further credit expansion in the asset.
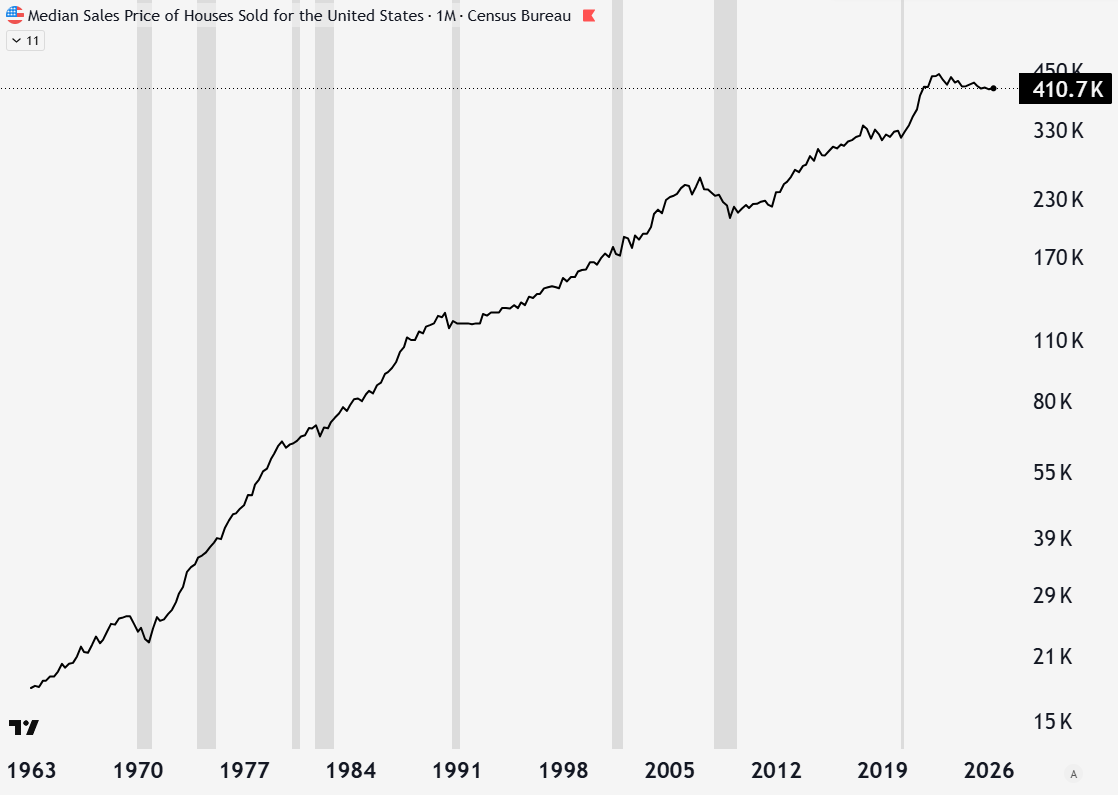
The biggest affordability issue is expensive housing prices. Since the turn of the century, prices have gone from $163k to $410k. Prices of new houses sold have actually moderated since July of 2022. At the same time, existing home sales have decreased significantly.
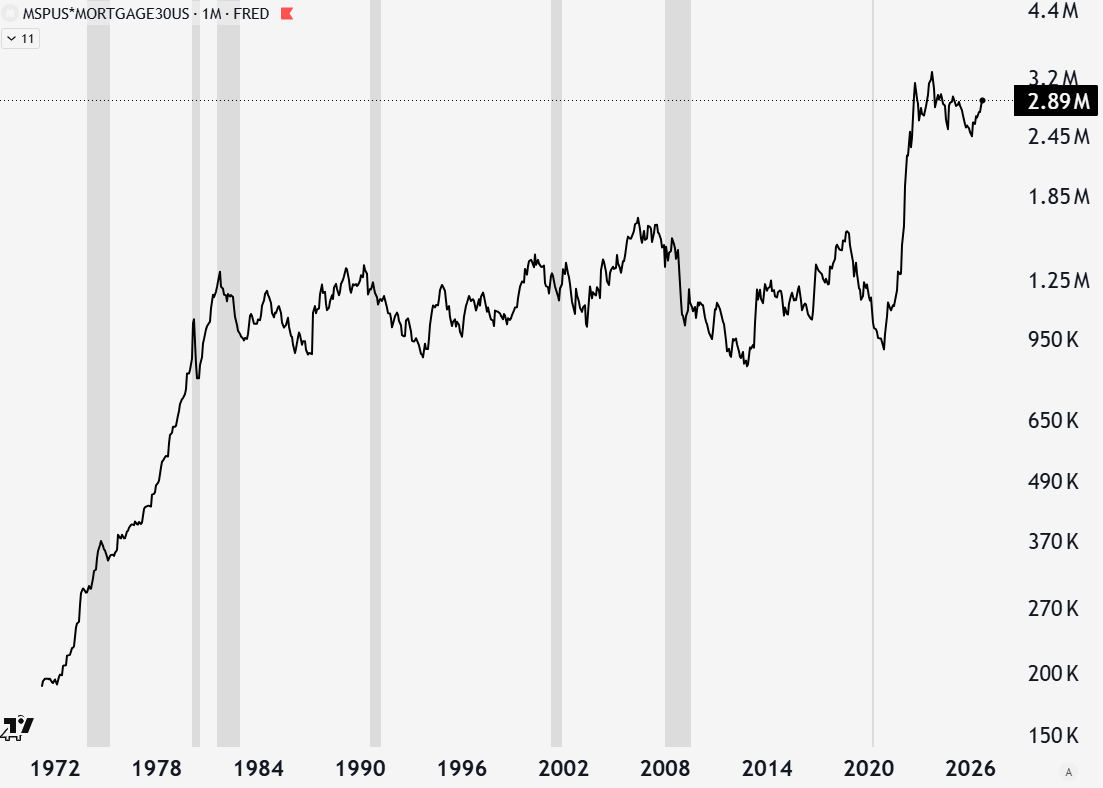
This is due to rising mortgage rates, which have caused the cost of an already expensive house to explode even higher. Many people argue that the 1980s high mortgage rates made today’s housing affordability look like nothing. They fail to take into account that housing prices weren’t as high. A composite of prices and interest rates clearly shows that total home cost has never been more extreme.
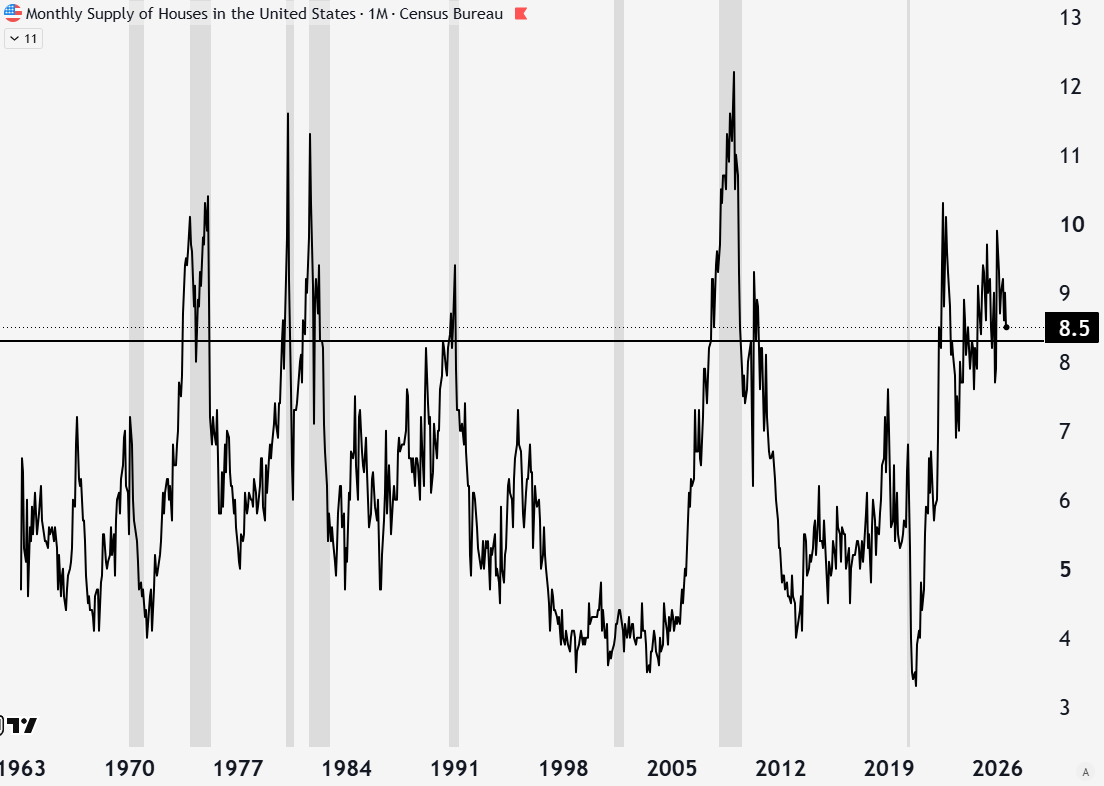
This has caused a complete freeze in housing transactions. People with 3% mortgage rates would be out of their minds to give it up for a 7% one and pay double their current costs for the same house. New entrants into the housing market are trapped in an affordability crisis. The monthly supply of new houses is at 8.5 months, which is at levels only reached in the early 1970s, early 1980s, 1990, and 2008. Over 8.3 months’ supply has historically always been followed by a recession.
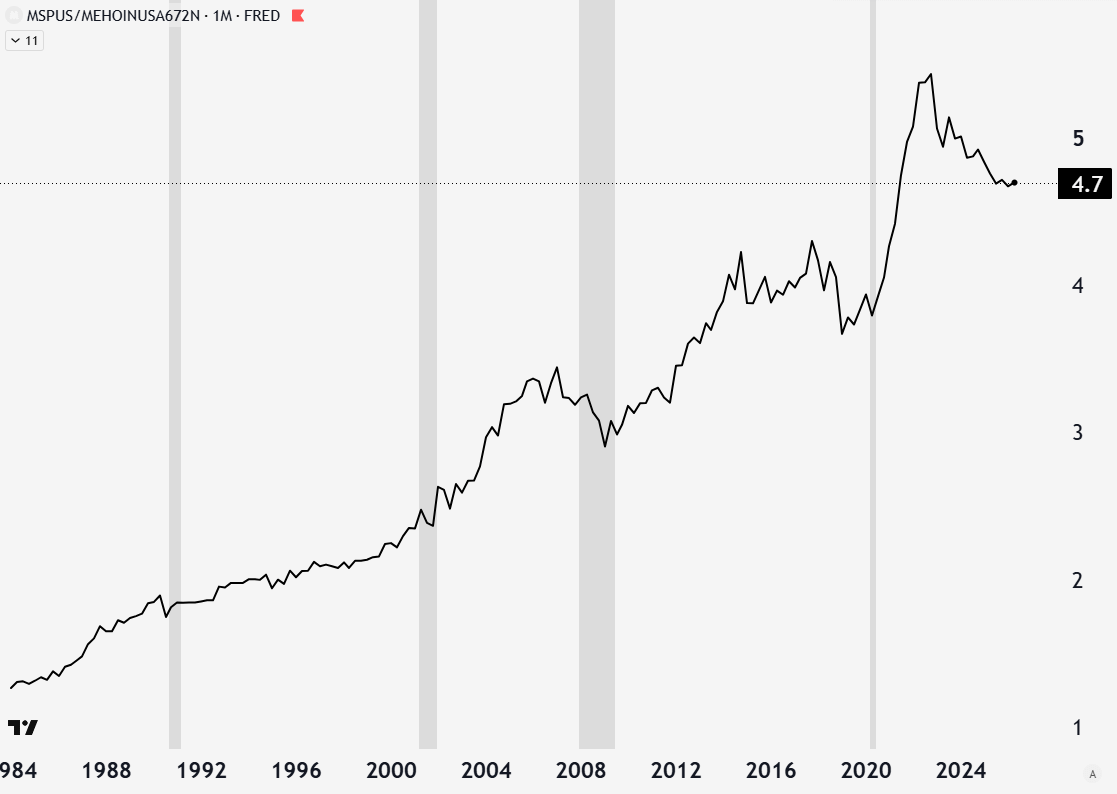
To truly tell whether housing is expensive historically, we can compare it to the median income. The chart looks even more extreme when taking interest rates into account (for the 80s interest rate people). Today, new housing prices are 4.7 times the median income. Existing homes are even worse than the chart below suggests (~5-6x) since stubborn homeowners are less willing to cut prices than new home builders who are in the business of doing what it takes to sell homes. Housing is more expensive than ever in history compared to what really matters: incomes.
A simple Google search suggests that “housing becomes more expensive relative to incomes over time because the physical supply of buildable land and new construction fails to keep pace with growing population demand and economic productivity.” Looking forward, this is a questionable premise. Fertility rates are below replacement levels, demographics are of an aging population, and markets look to be at extreme overvaluations.
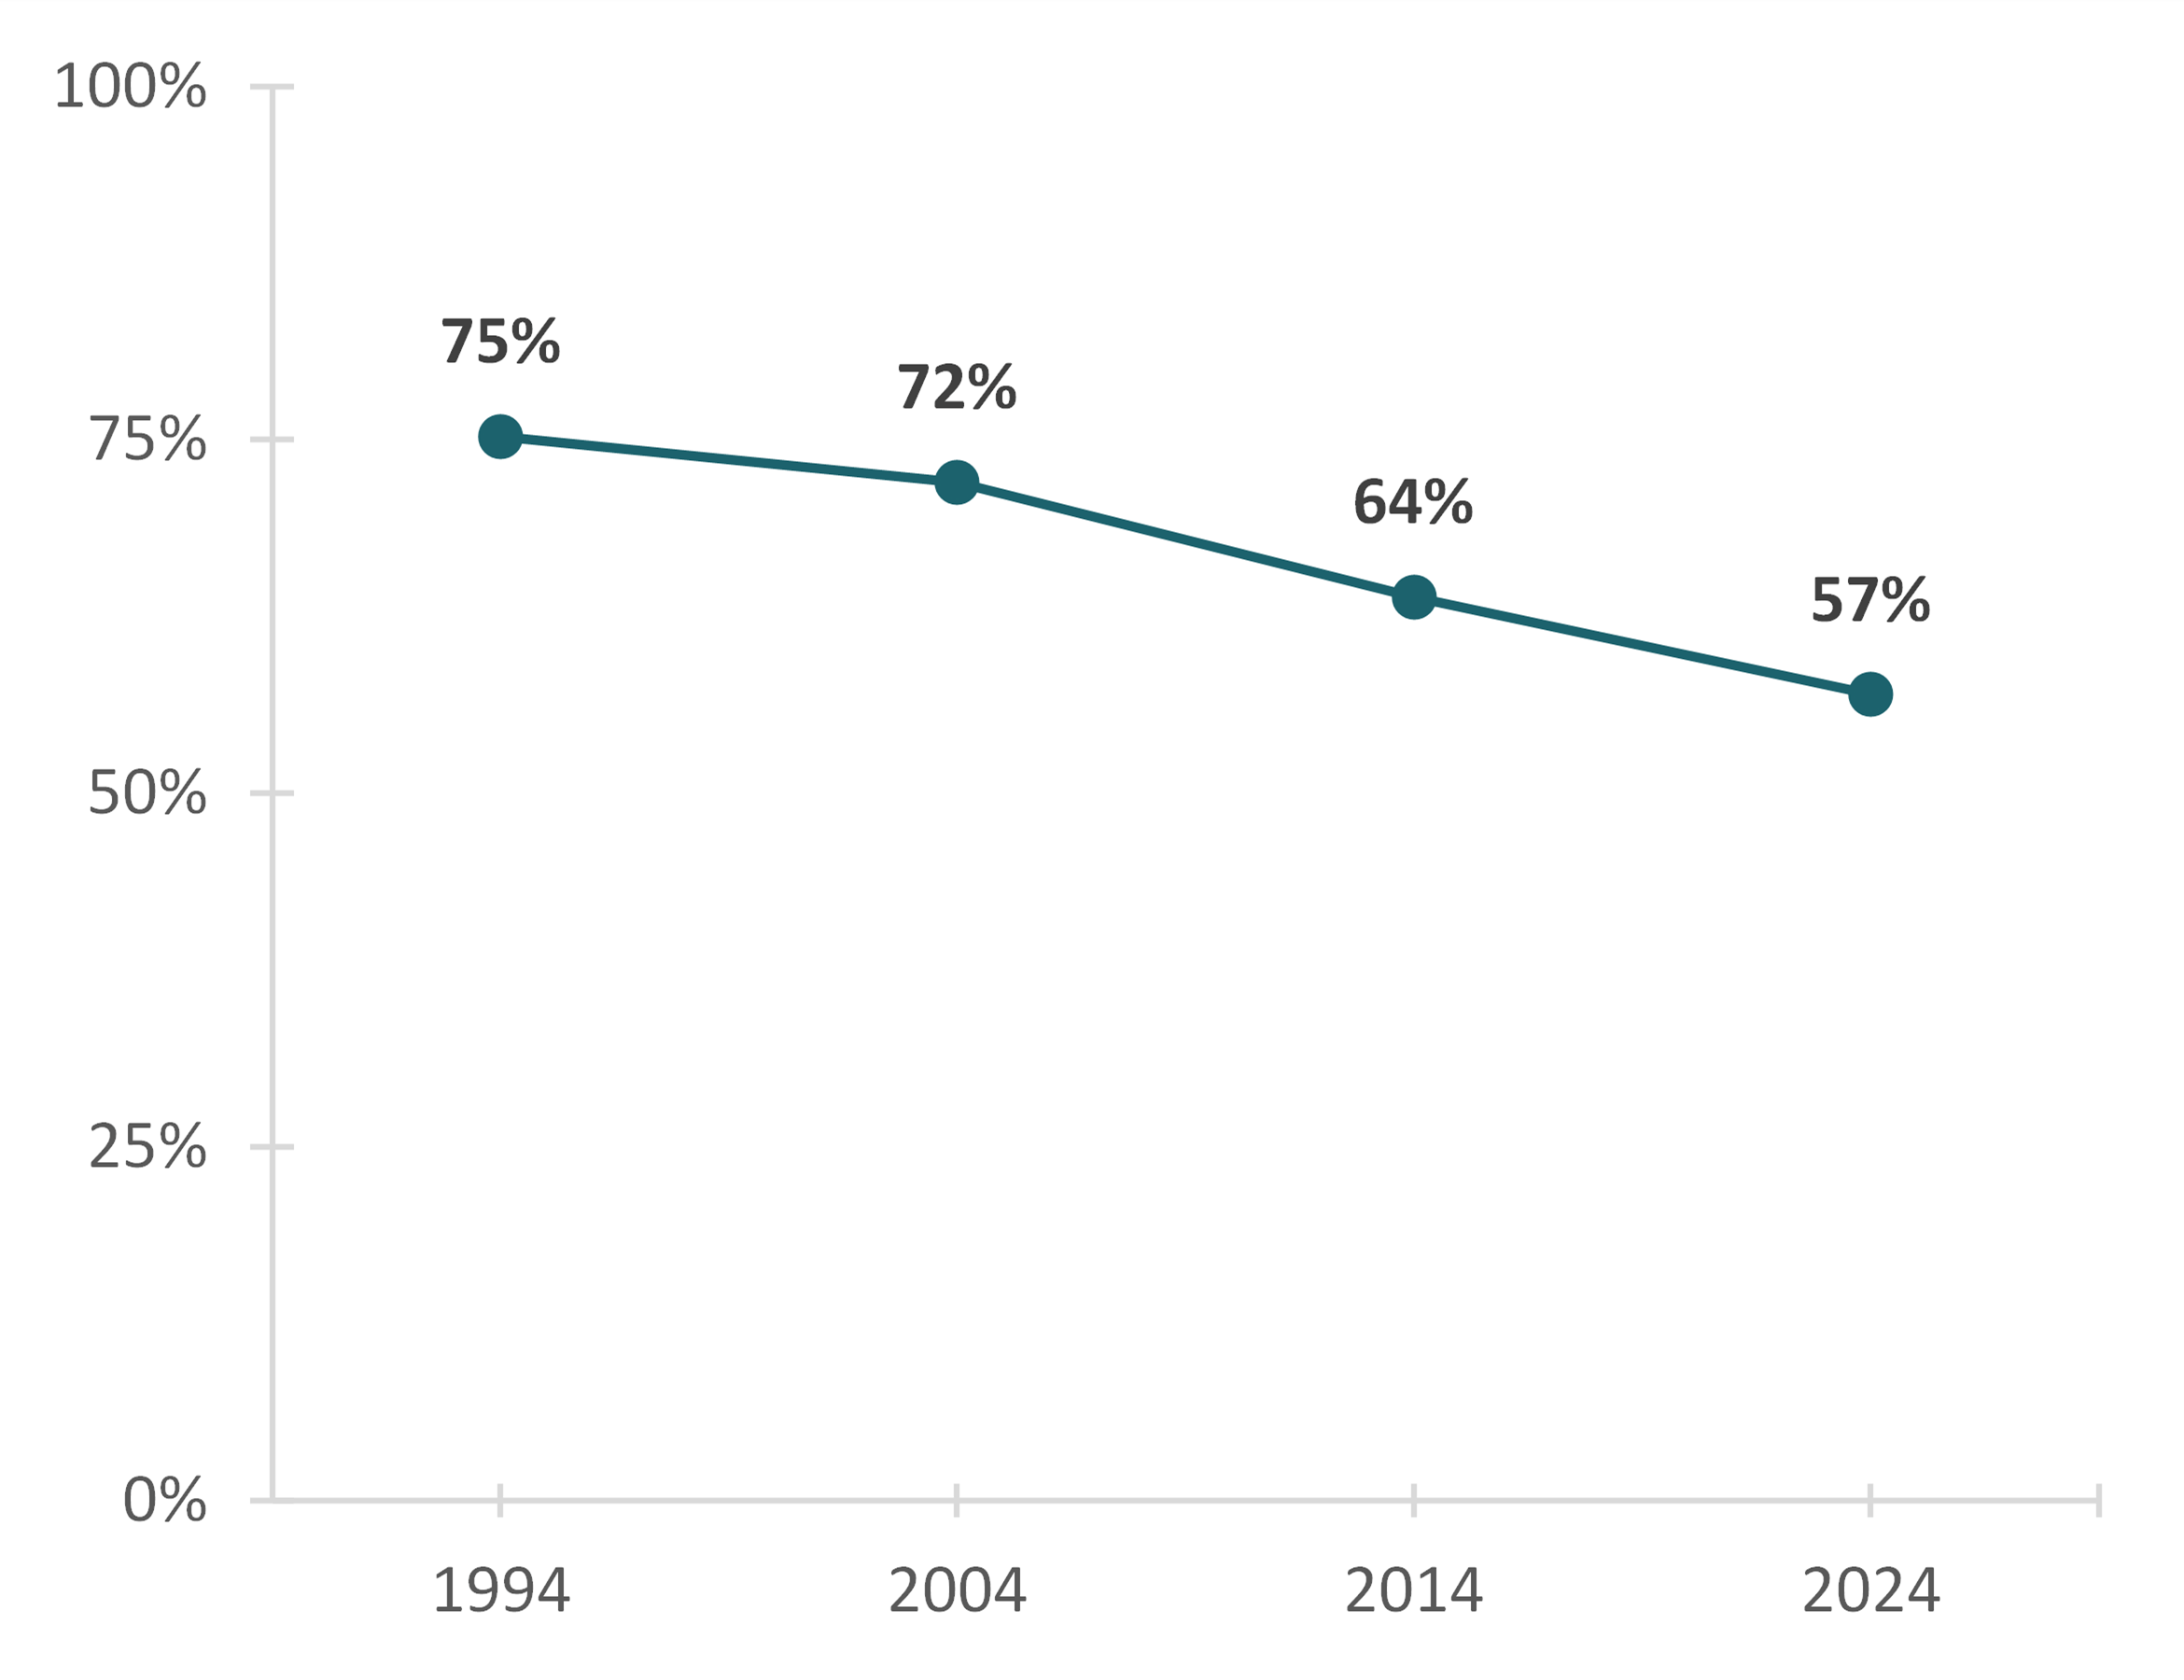
Not only are there fewer total 30-34 year-olds due to aging demographics, but there are fewer married couples (the cohort buying houses). In 1994, 75% of 34-year-olds had been married, but in a few years’ time married by 34 will be a minority group. The ability for immigration to solve these issues is questionable and hotly debated.
This whole article has shown how expensive housing is compared to history and implied that it will be difficult to continue on that trajectory. What if there were a metric where housing looked cheaper than any other time in history? A house today is 100oz of gold, cheaper than the previous low in 1981. This ratio has typically been 200-700oz. Mean reversion would suggest ~200oz for a house, which would coincide with a 1980s post-stress economic recovery that lasts two decades.
Given my research, this seems unlikely, and if gold stayed flat would require home prices to further double from here. Conversely, gold would have to drop by 50% for housing prices to stay where they are. This also seems unlikely with the bullishness of gold and monetary debasement themes. Maybe there are no more recessions, we enter another 80s bull market, and there’s a mix of housing appreciation and gold depreciation to mean-revert this ratio?
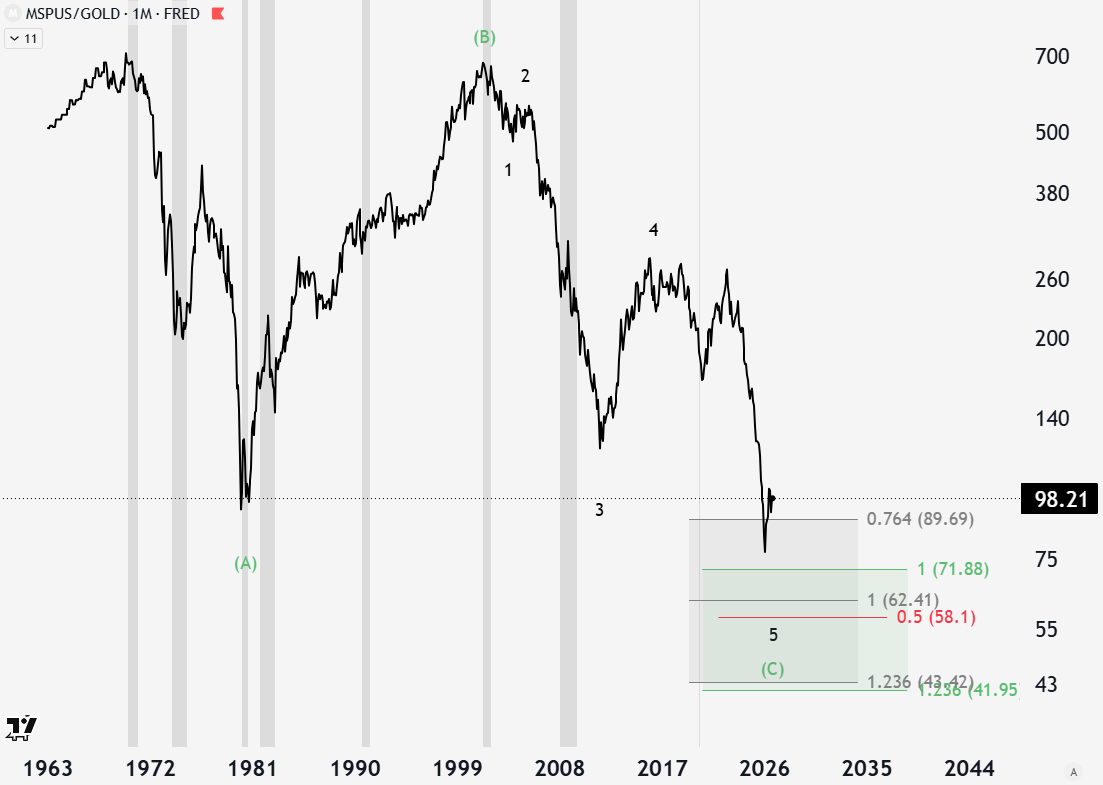
Housing/gold has dropped hard three times: the 1970s, 2000s, and now. All three coincided with massive gold bull markets. This ratio is likely more about gold than it is about housing. This implies that the mean reversion occurs when the gold bull run is over. At these extreme levels, it might already be.
Using technical analysis, it looks like this ratio could use another low. If the long term is making a huge abc correction, with the c-wave being a 5-wave decline, 58-71 is the target range. This coincides with the fundamental case better as well. The economy is not ending a lost decade in stocks with heavy inflation and is ready for a new bull market. It looks more like the complete opposite.
I propose a scenario where gold may do well and create another high before it begins its bear market, while housing prices struggle as affordability is not solved. If a recession is triggered, housing will also likely struggle equally or more than gold, furthering the deterioration of the ratio.
Then we are very likely to have mean reversion at some point soon. Gold speculation subsides, the price stagnates, or a new bear market begins. Housing and other real assets may begin another bull market.
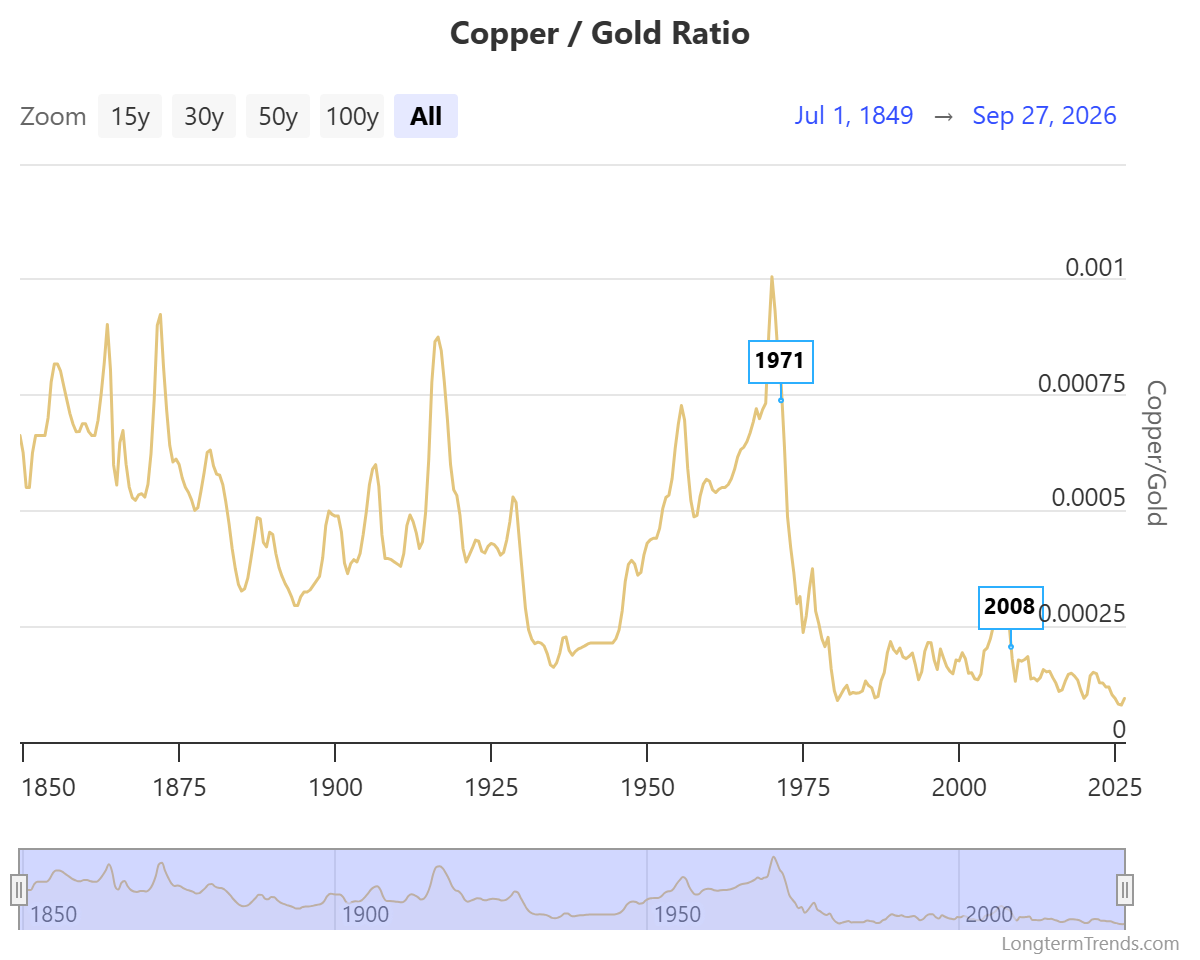
Even without a natural bull market, financial repression and excessive money printing could cause a bid for real assets, which drives the ratio compared to gold higher. The gold bull run in the 1970s did not stop copper prices from outperforming. Gold is expensive relative to housing and copper, which has been much higher in the 1870s, 1920s, and 1970s. We are at post-fourth-turning (1870s, 1930s) levels in the copper/gold ratio when no fourth turning has occurred yet. I suspect there could be some wild swings in copper/gold and housing/gold this decade.
The housing/gold ratio implies a Goldilocks economy is more likely based on historical ratio mean reversion. However, housing is more expensive relative to incomes than ever before, with bleak demographics a headwind. If it doesn’t look like housing will be surging any time soon, something else must be going on.
I argue the ratio has more room to the downside before the regime switches. As long as gold remains elevated, so will the ratio since gold volatility is higher than housing. My work also suggests a looming recession, which would put downward pressure on housing and gold.
Only after the recession is it likely that housing and real assets truly outperform gold long term, even if debasement sends gold higher as well. To be on the right side of these outcomes and not be caught off guard by the chaotic fourth turning environment we are in, subscribe for access to the Gray Area Model Portfolio to learn how to actually diversify, navigate bubbles/bear markets, and deliver superior risk-adjusted returns.
-Grayson
Like to see these asymmetric opportunities synthesized into a real model portfolio that beats the S&P 500 and avoids major downside risks?
Socials
Twitter/X - @graysonhoteling
Email - thegrayarea55@gmail.com
Archive - The Gray Area
Notes - The Gray Area
Promotions
Sign up for TradingView
For educational and entertainment purposes only. The Gray Area should not be taken as financial advice.