
Follow The Money
China is on the opposite side of the liquidity cycle. Here's what that means for gold and Chinese tech.

If you find this article interesting, click the like button for me! I would greatly appreciate it :)

Most people think that since the Federal Reserve has had elevated interest rates and has not been performing quantitative tightening (QT), liquidity conditions in the US are tight. This is a policy headfake that is actually not true at all. While not performing full-blown quantitative easing (QE), they have been making other liquidity injections as needed since 2022. The major source of liquidity, though, has been from the US Treasury.
Beginning under Yellen and continuing under Bessent (even though he campaigned on stopping it), the Treasury has been issuing shorter-term debt to fund the government. It’s a bit complicated, but bond duration affects liquidity. By juicing the economy with billions of Treasury bills instead of bonds, it contributes to more liquidity and easier monetary conditions. Combine that with higher interest rates actually helping the pay mega-cap corporations with excess cash, who are driving most economic investment, and things have been pretty good monetarily.

No one knows liquidity cycles better than Michael Howell of Capital Wars. His model below suggests that liquidity has peaked in late 2025 and is only now tightening. Again, it seems counterintuitive that now that the Fed is lowering interest rates, liquidity conditions will tighten. The reasons are a deteriorated reverse repo facility, a strong real economy that pulls money out of the financial economy, and the debt maturity wall and refinancing cycle finally arriving. These are also reasons why recession forecasts have been delayed, because there was more to the story.
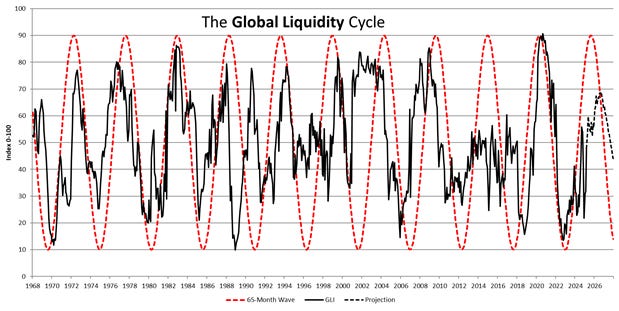
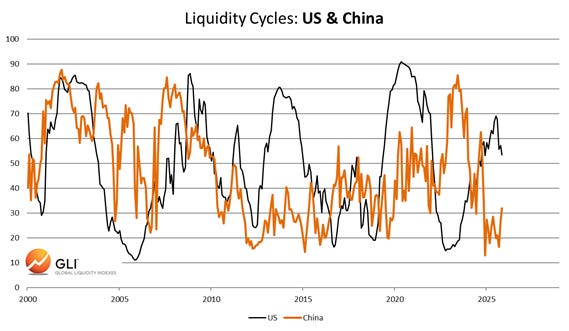
Most of the world is on a similar timeline to the US or a little behind. China, on the other hand, has already faced massive deflationary pressures in its housing market in recent years. In Howell’s eyes, China’s money printing is not about currency value and attractive exports, but the debt-to-liquidity ratio. If it is too high, problems occur. Similar to Japan in the 1990s, China is having to print money post-debt crisis.
This means China is on the opposite side of the liquidity cycle. To avoid further calamity in domestic assets and protect their financial system, they are printing huge amounts of money to inflate away the debt. They have had tight conditions and are beginning to loosen them. This is the opposite of the US, which has had loose conditions and is trending tighter. This will soon be what the US does with its enormous debt pile when collateral/liquidity dries up.
There are certainly flaws in this strategy by China, but with capital controls on the Yuan and gold exports, they have effectively blocked the exits. What this means is that the newly printed Yuan can keep a relatively stable dollar exchange rate and freely devalue against gold domestically (a big reason for gold’s recent success). This suggests further upside for gold, as the gold run may not actually be the “debasement” trade, but rather a China liquidity consequence that is likely to continue.
As an investment theme, this means that instead of nearing the danger zone, China is past it. Further, with the capital controls, the domestic monetary injections have to go somewhere. While they are hoping this helps stabilize the Chinese real estate market, it is going into other assets like gold and stocks.
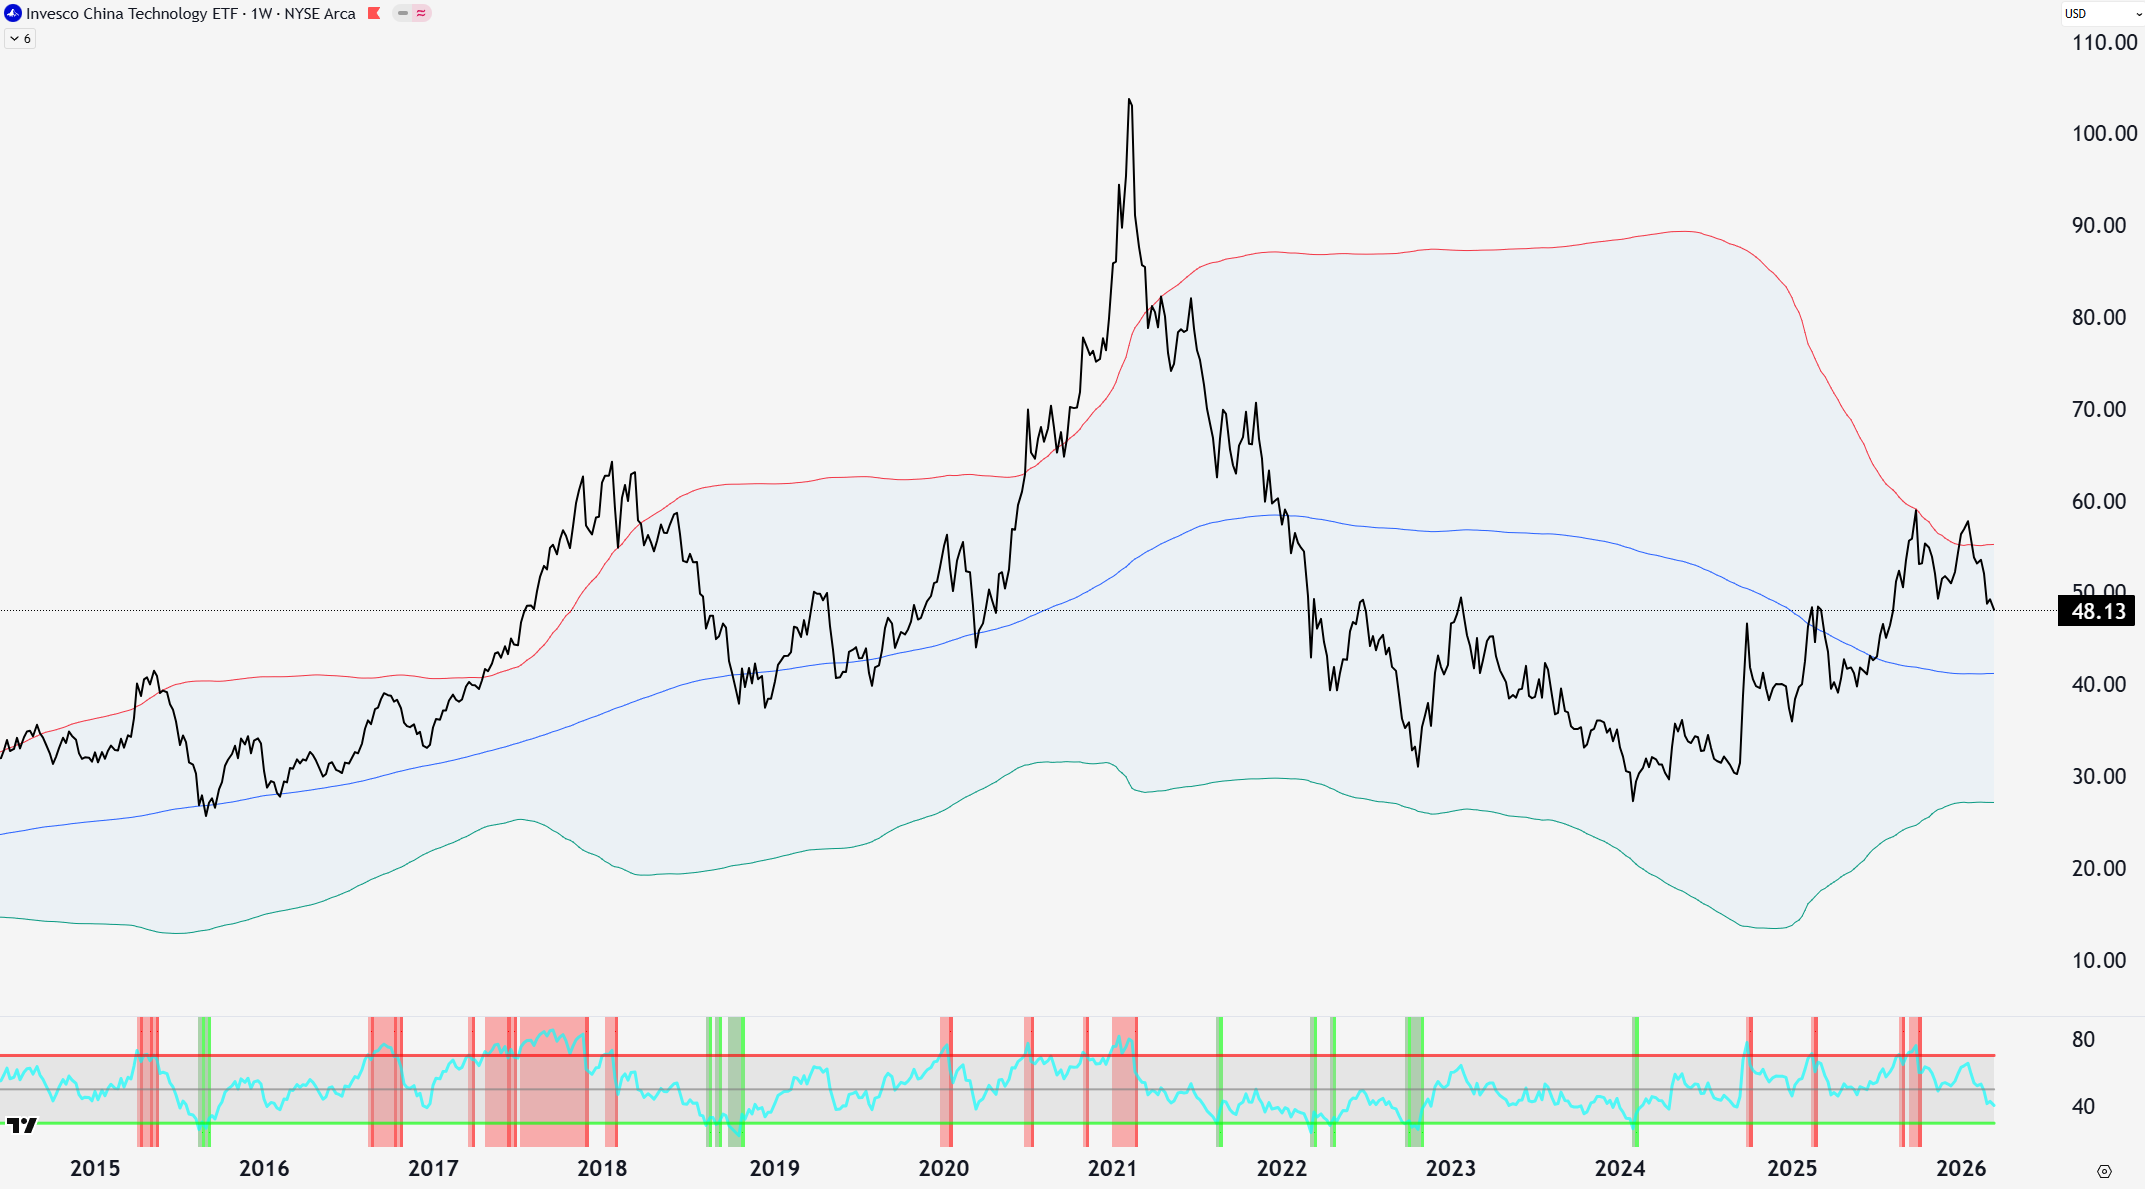
Is the Chinese stock market a good value? Looking at the tech sector (CQQQ), after dropping 73% (Feb 21 to Feb 24), it went up 110% in just 2 years (Feb 24 to Feb 26). This put it near the upper band (upper red line) of its four-year average (middle blue line). This four-year average should act as resistance to bounce off of in a bull market, as seen in 2015/16 and 2019/20. The top and bottom bands' widths are also shrinking, meaning consolidation is happening, often before a more aggressive move. The bottom RSI value measures relative strength (momentum), and is showing that it is not relatively expensive anymore. A little more correction may provide a solid buying opportunity.
Looking at the key levels and Elliott Wave Theory, we can get an idea of future scenarios. Given the chart data, which can be seen below, there are two options: 2021 was the top, or we could challenge new highs again.
If 2021 was the top, you would expect a correction before going lower (below circle 5 of C at 27). This correction is denoted by the large green box. Typically, this would target the 0.5-0.618 retracement. The current retracement (higher) has only gone to the 0.382 level, meaning it isn’t likely over yet. This, however, is the ideal target for green wave A of an ABC pattern up. If the lower support region in grey holds (also near the four year average), then the green C wave would perfectly target near the ideal 0.618 level.
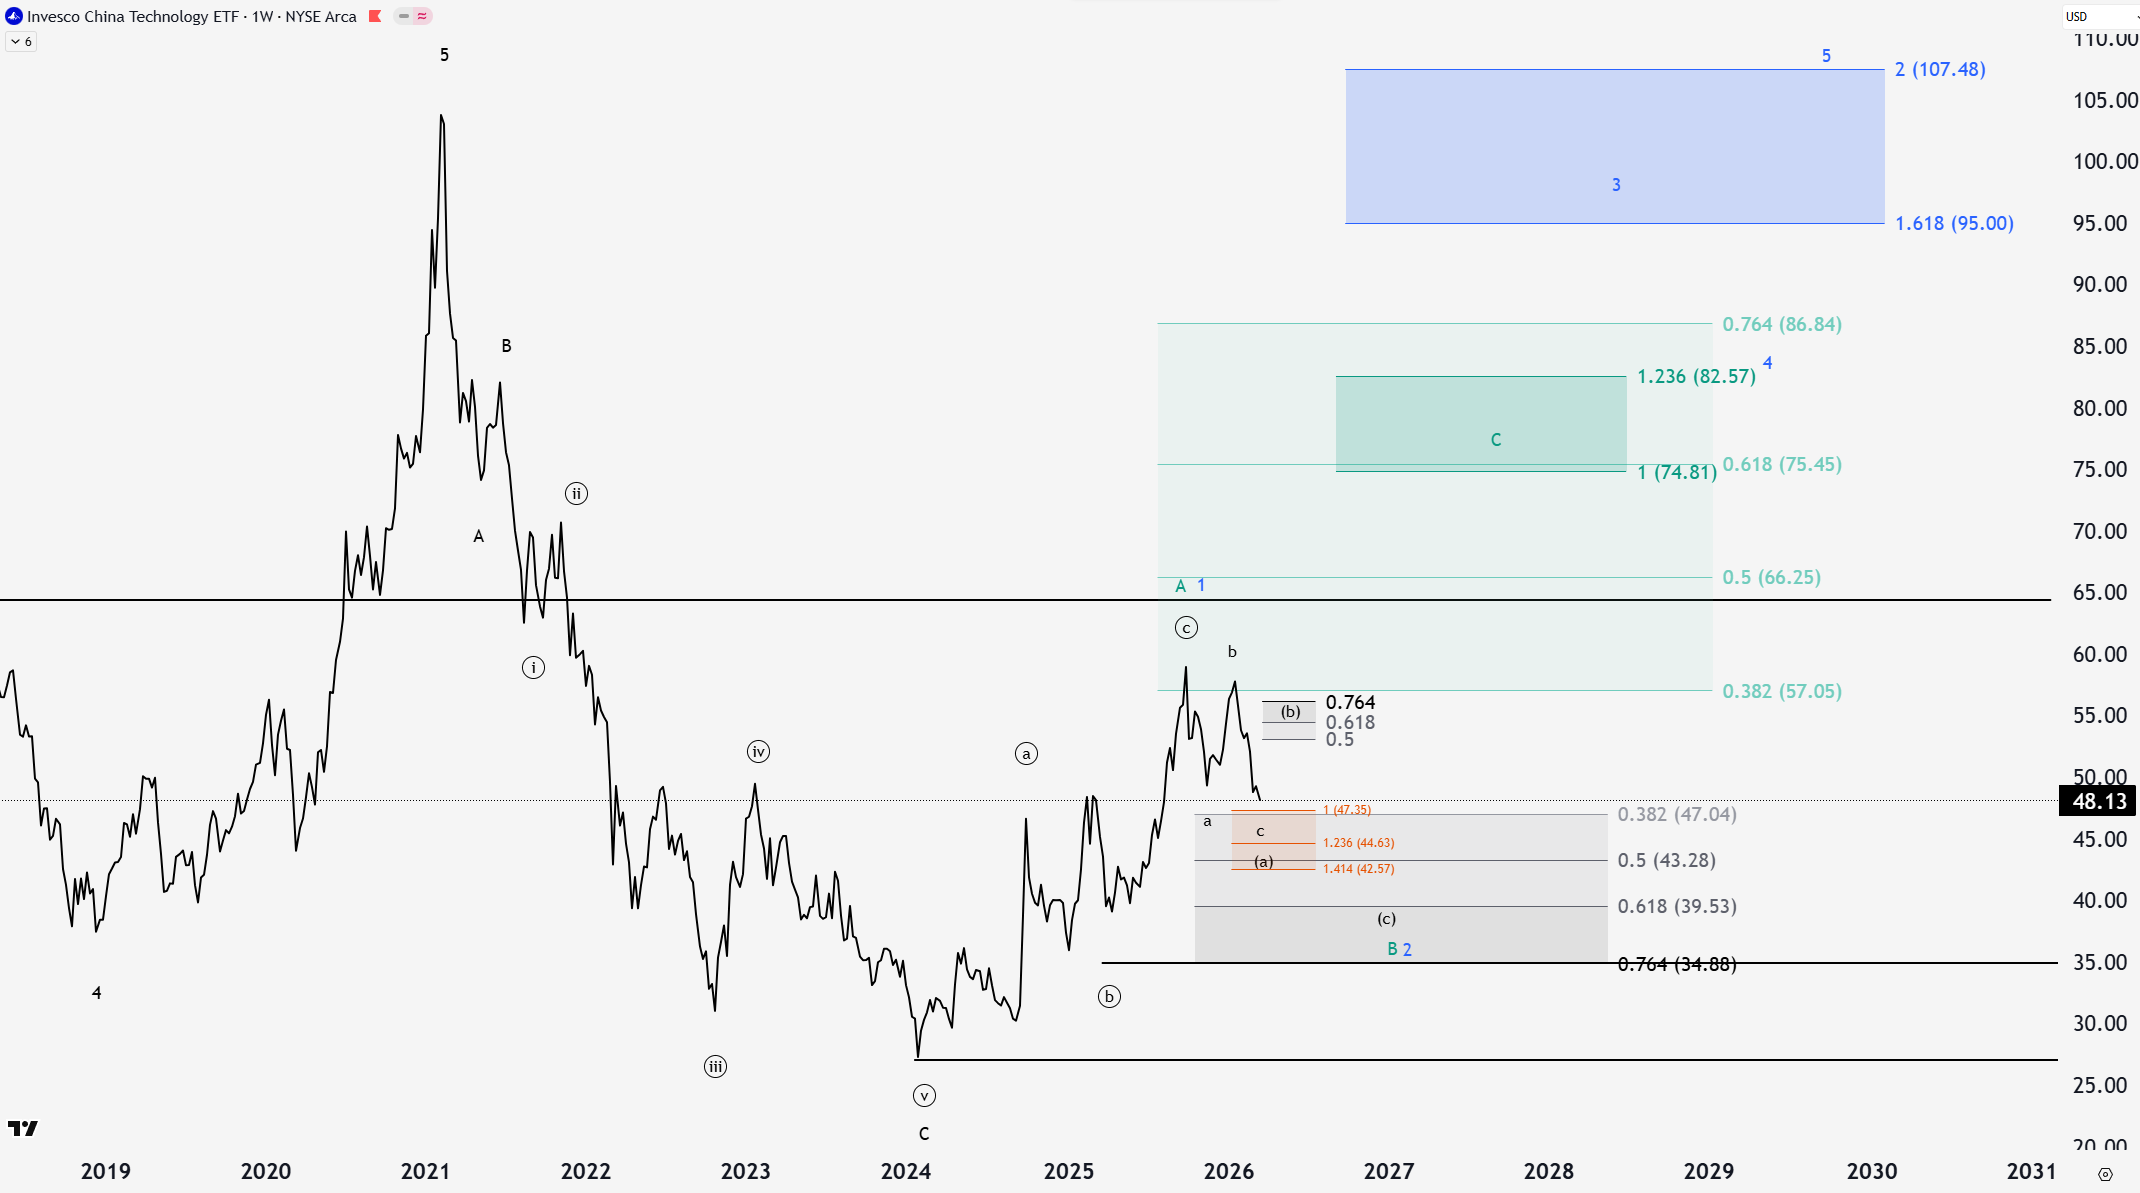
The even more bullish case is if Feb 2024 was the bottom. I would still expect the same further into the grey box and a retest of that four year average. From there, the blue 5 wave move could be on the table which would target the highs around 100. Regardless, there is 70% upside in green, or 120% upside in blue.
How I’m wrong. In the shorter term, if the price follows through below the four-year average and below 34.88, it is likely something more immediately bearish is going on. That is not something I want to be investing in. If lower grey box support holds, my ideal buy would be between 39 and 43. Then there is a great risk-to-reward with a stop loss at that 34.88 level.
Given a bit more of a pullback to retest the four-year average and the wave B/2 support, Chinese tech stocks would be in a nice technical setup. Layer in the macro view of an expanding Chinese liquidity picture, and there might be something there. Some may not want to or be able to invest in China, but it is a promising area to keep an eye on.
-Grayson
Like to see these asymmetric opportunities synthesized into a real model portfolio that beats the S&P 500 and avoids major downside risks?
Socials
Twitter/X - @graysonhoteling
Email - thegrayarea55@gmail.com
Archive - The Gray Area
Notes - The Gray Area
Promotions
Sign up for TradingView
For educational and entertainment purposes only. The Gray Area should not be taken as financial advice.
Interesting! Others having been pushing emerging market ETFs but you present an intriguing scenario.