
Keep It Real
Are your precious stock market returns real?

If you find this article interesting, click the like button for me! I would greatly appreciate it :)
If I asked you if the dollar or gold changed more over the last 50 years, what would you say? The dollar has been relatively stable over that time, providing a medium of exchange, unit of account, and store of value. It did lose value, however. CPI inflation grew 3.7%/yr and the money supply 6.5%/yr. This means you would not have wanted to put cash under your mattress, but chase higher wages and invest excess capital into other assets. Gold, bonds, and stocks are common stores of value better than cash. 10-year treasury bonds averaged 5.9%/yr, gold 6.5%/yr, and stocks 9%/yr over that time frame (results vary depending on starting point).
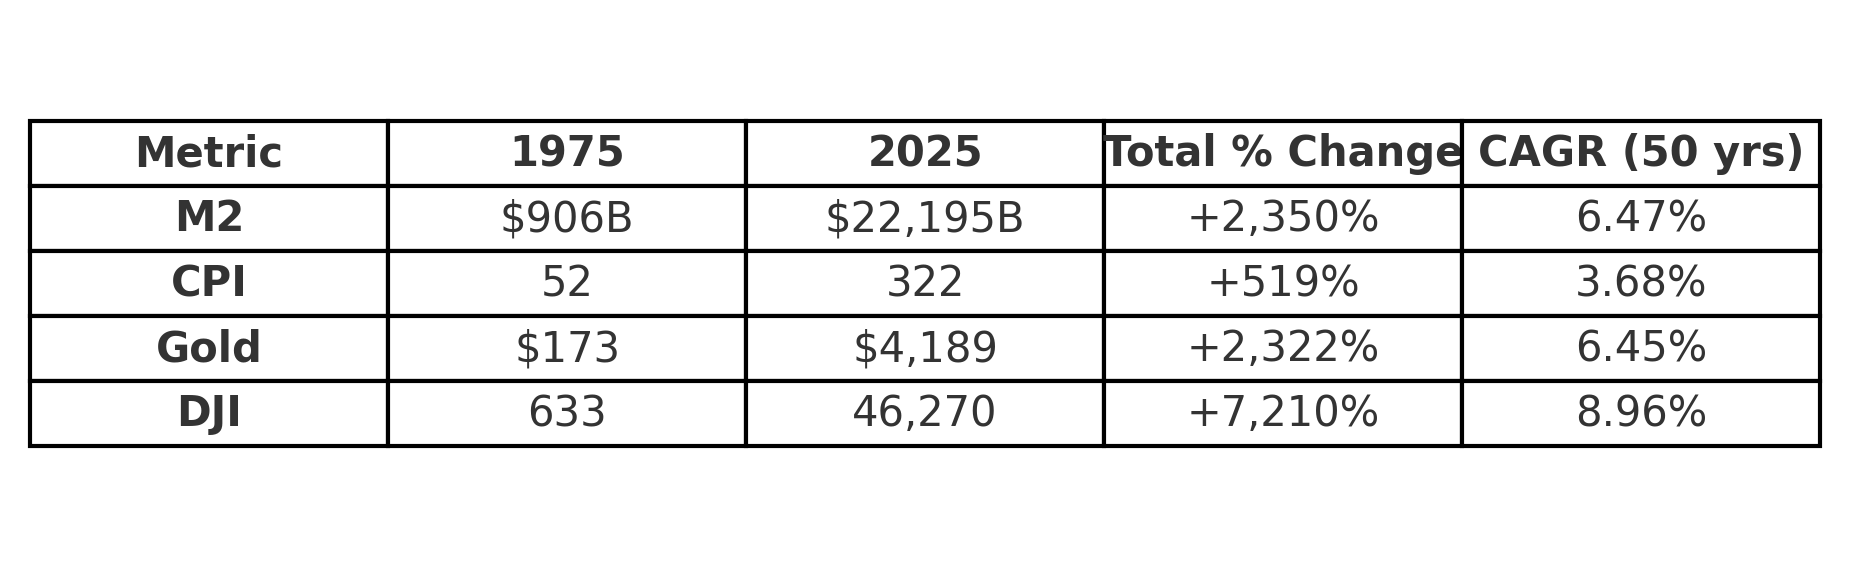
In 1975, a nice home cost $64k, whereas today it would be over $1million. You needed to have assets and not hold cash as the median home price went up 5.4%/yr over the last 50 years. In this sense, the dollar changed appreciably. In contrast, a 100oz gold bar would’ve bought the same asset then and now.

Is it fair to have our unit of account be the dollar even though it’s constantly depreciating? Perhaps gold or house prices are a better metric to compare prices. Houses, gold, and stocks all beat inflation since 1975, but only stocks beat the money supply growth, especially when dividends are considered. Pricing stocks in M2, gold, or housing prices may give us an idea of how much actual money is being made in the markets.
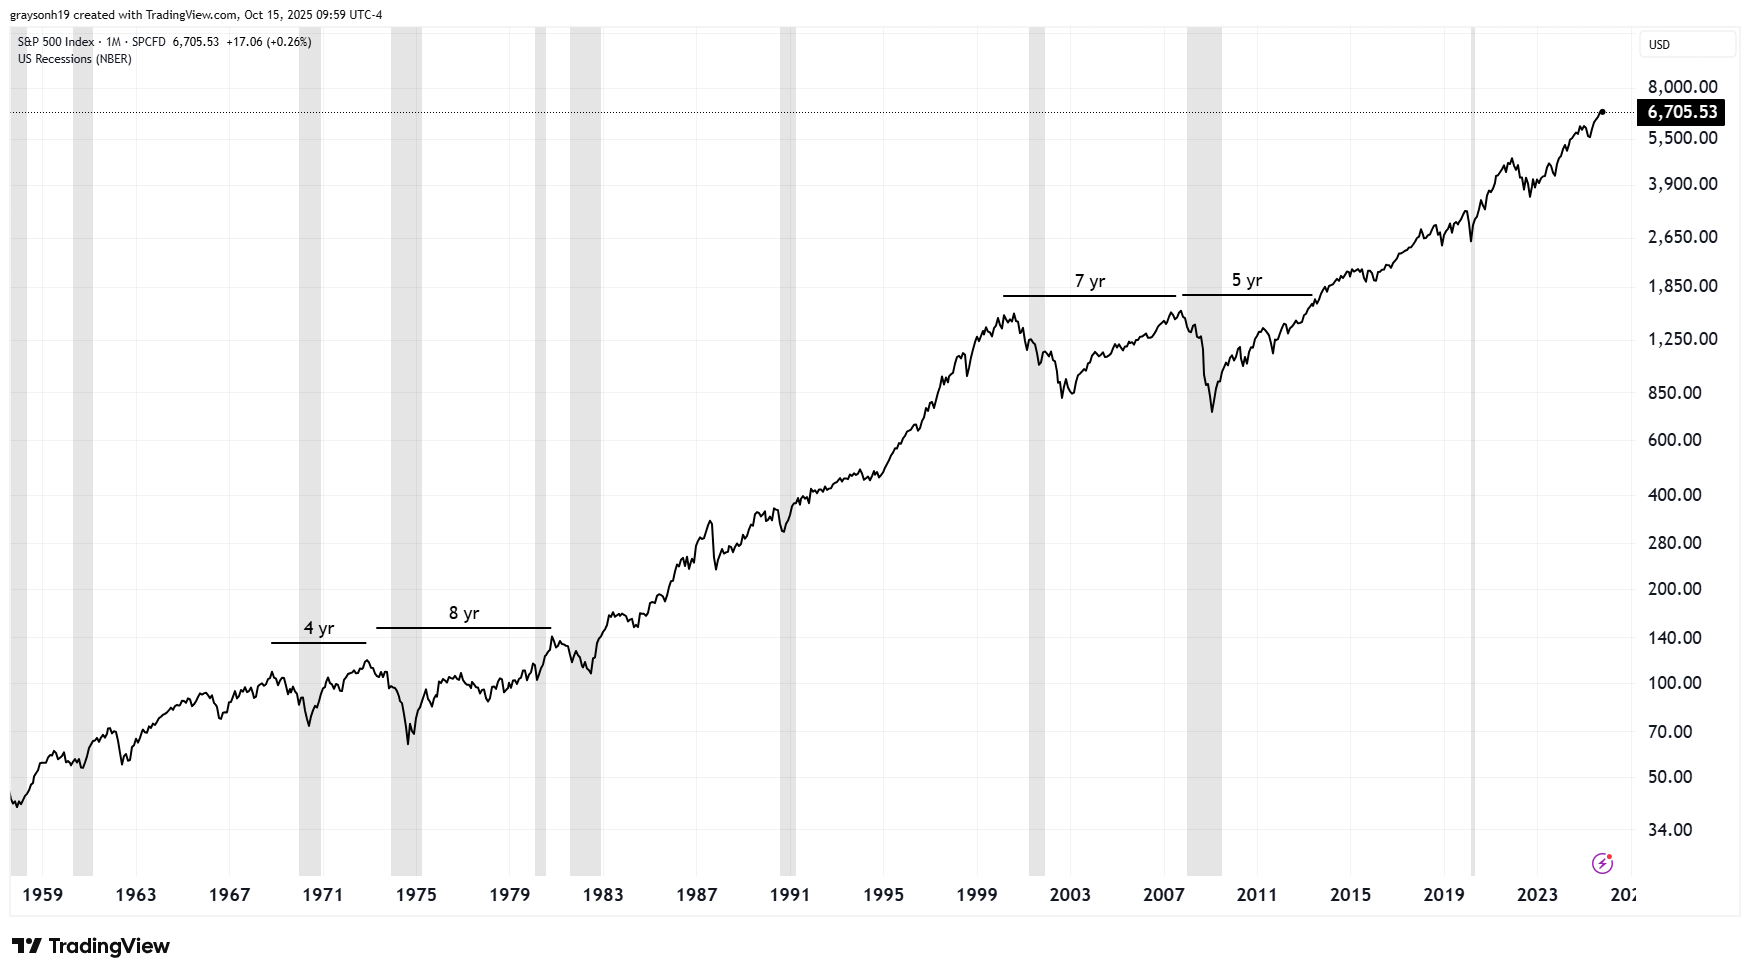
The S&P500, since 1950, has been a great investment. There were only three periods that took more than 4 years to break even, and most drawdowns only took ~2 years. The S&P 500 (SPX) is valued against the dollar, which means these are nominal returns. To get the real returns, we must divide by the inflation.
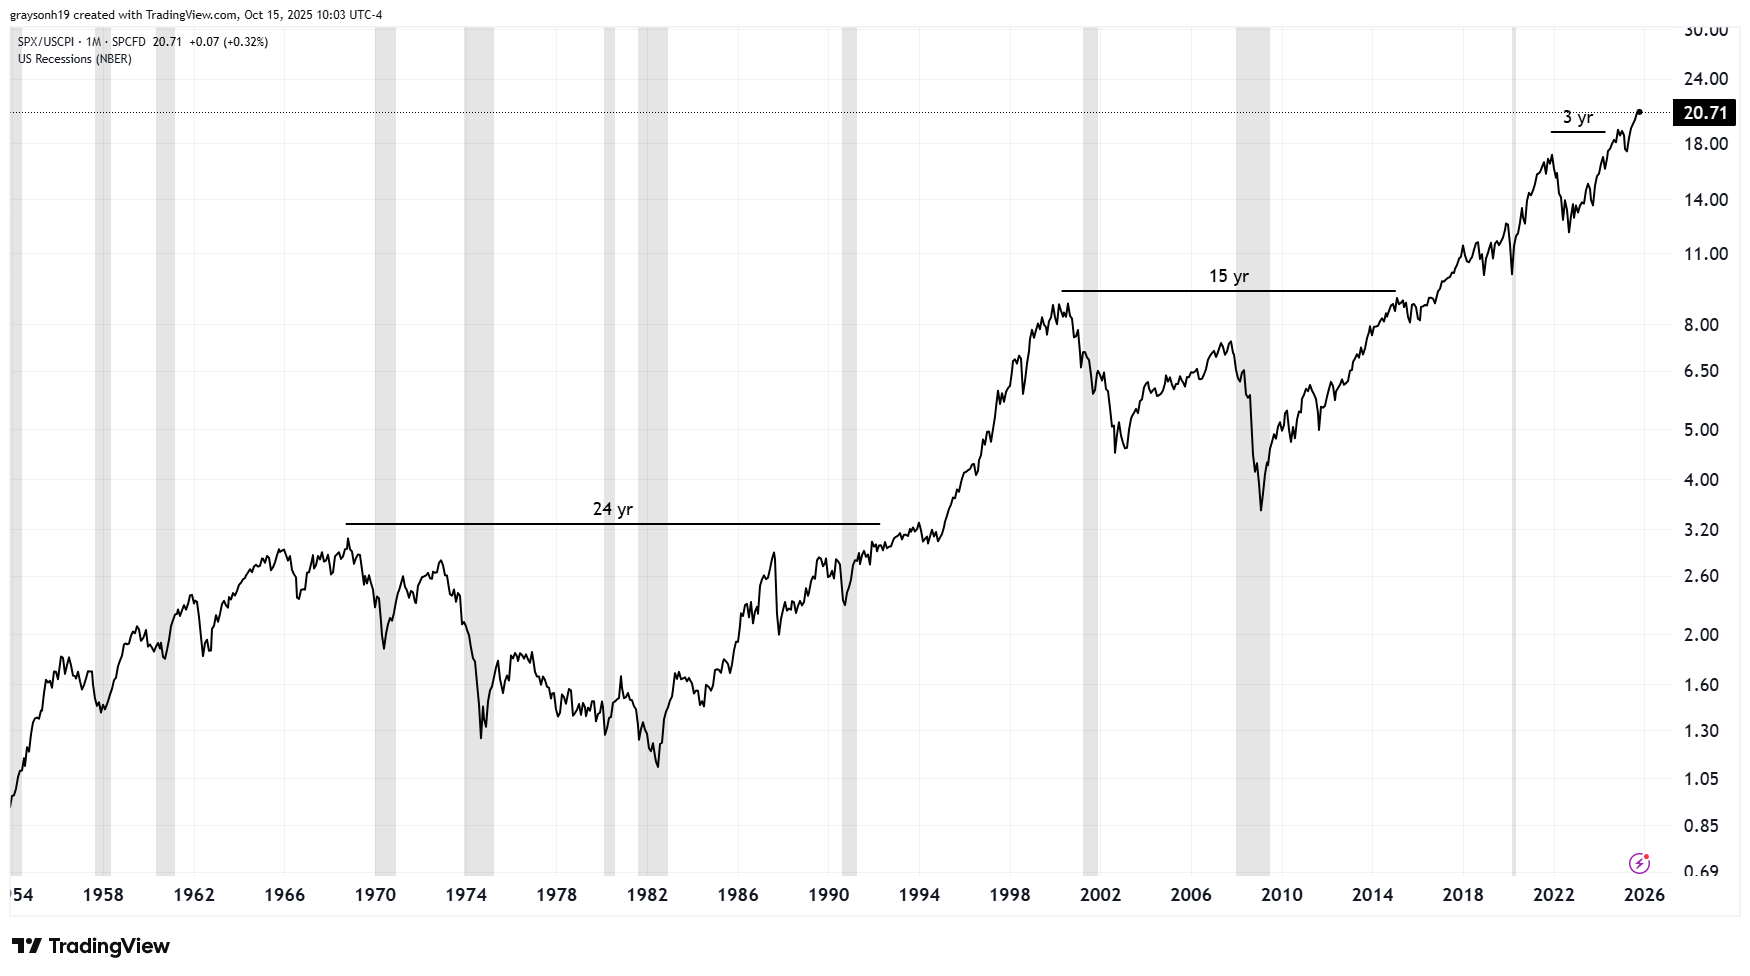
When comparing to CPI inflation, we see that the periods of drawdown were extended. Instead of small < 10-year periods, the breakeven time shoots to 24 years in the 70s and 15 years in the 2000s. During these times, a stock portfolio may have nominally returned value, but still lost in real terms.
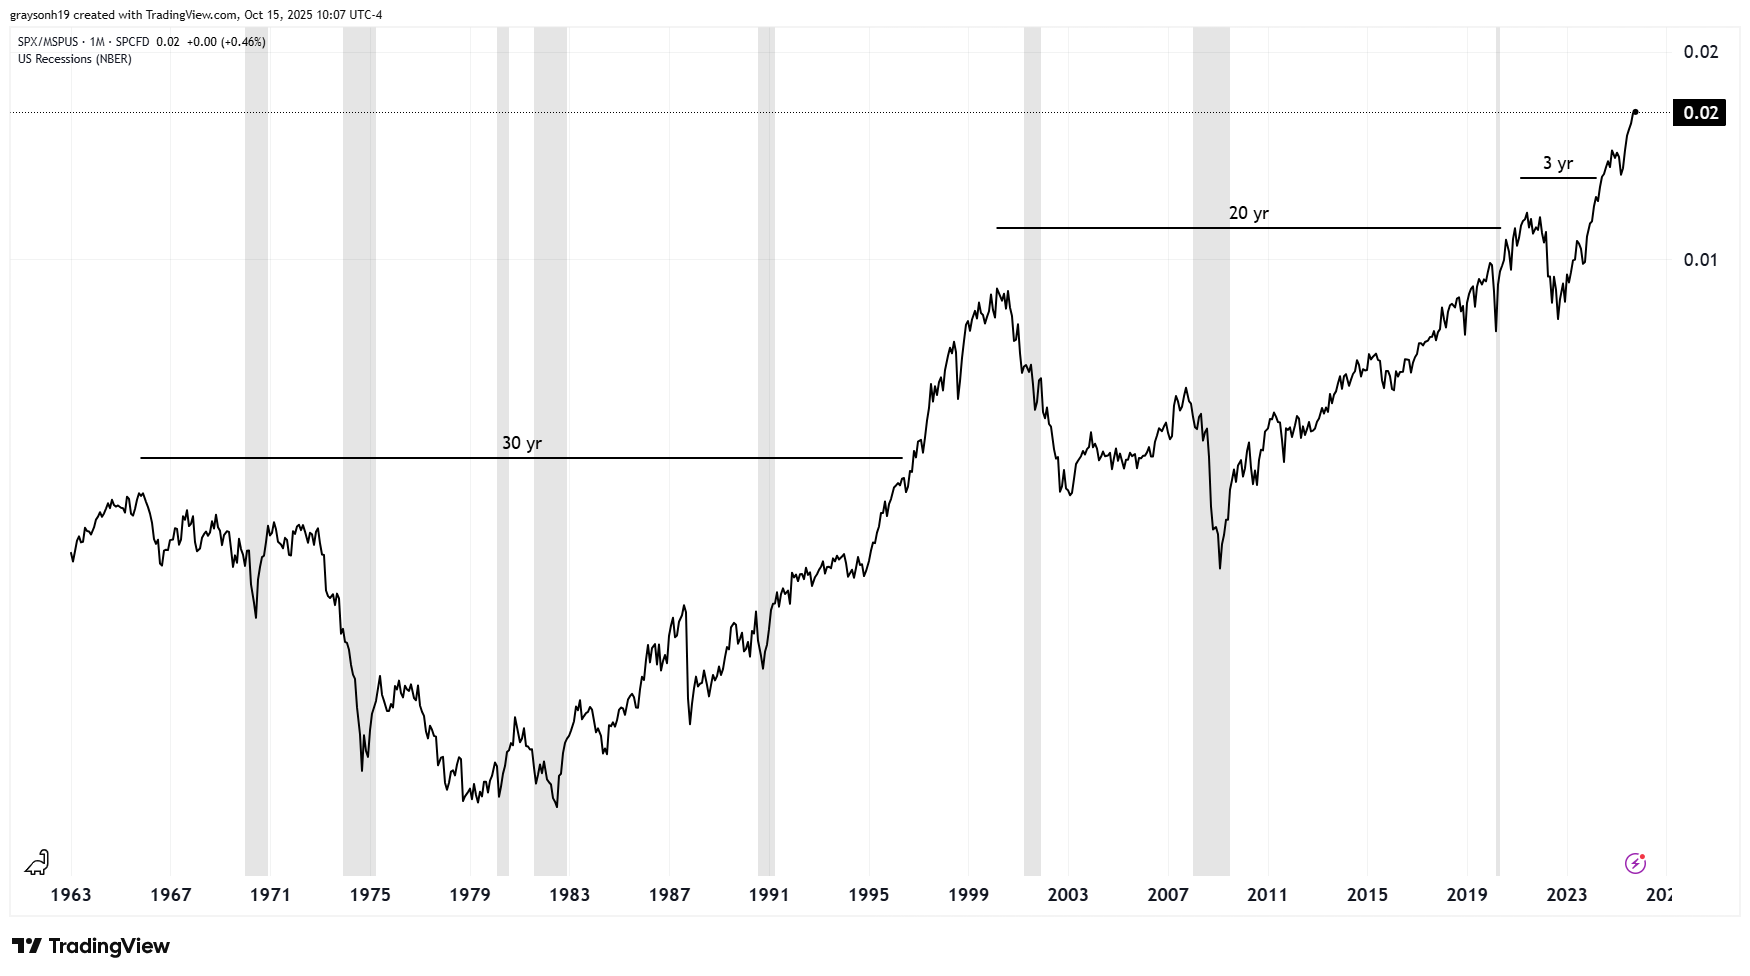
Compared to the median sold house price, it gets worse yet. Those breakeven time periods extend further, to 30 years and 20 years, respectively. Relative to the home you sleep in, stocks from 1963 to 1996 did not provide an excess return.
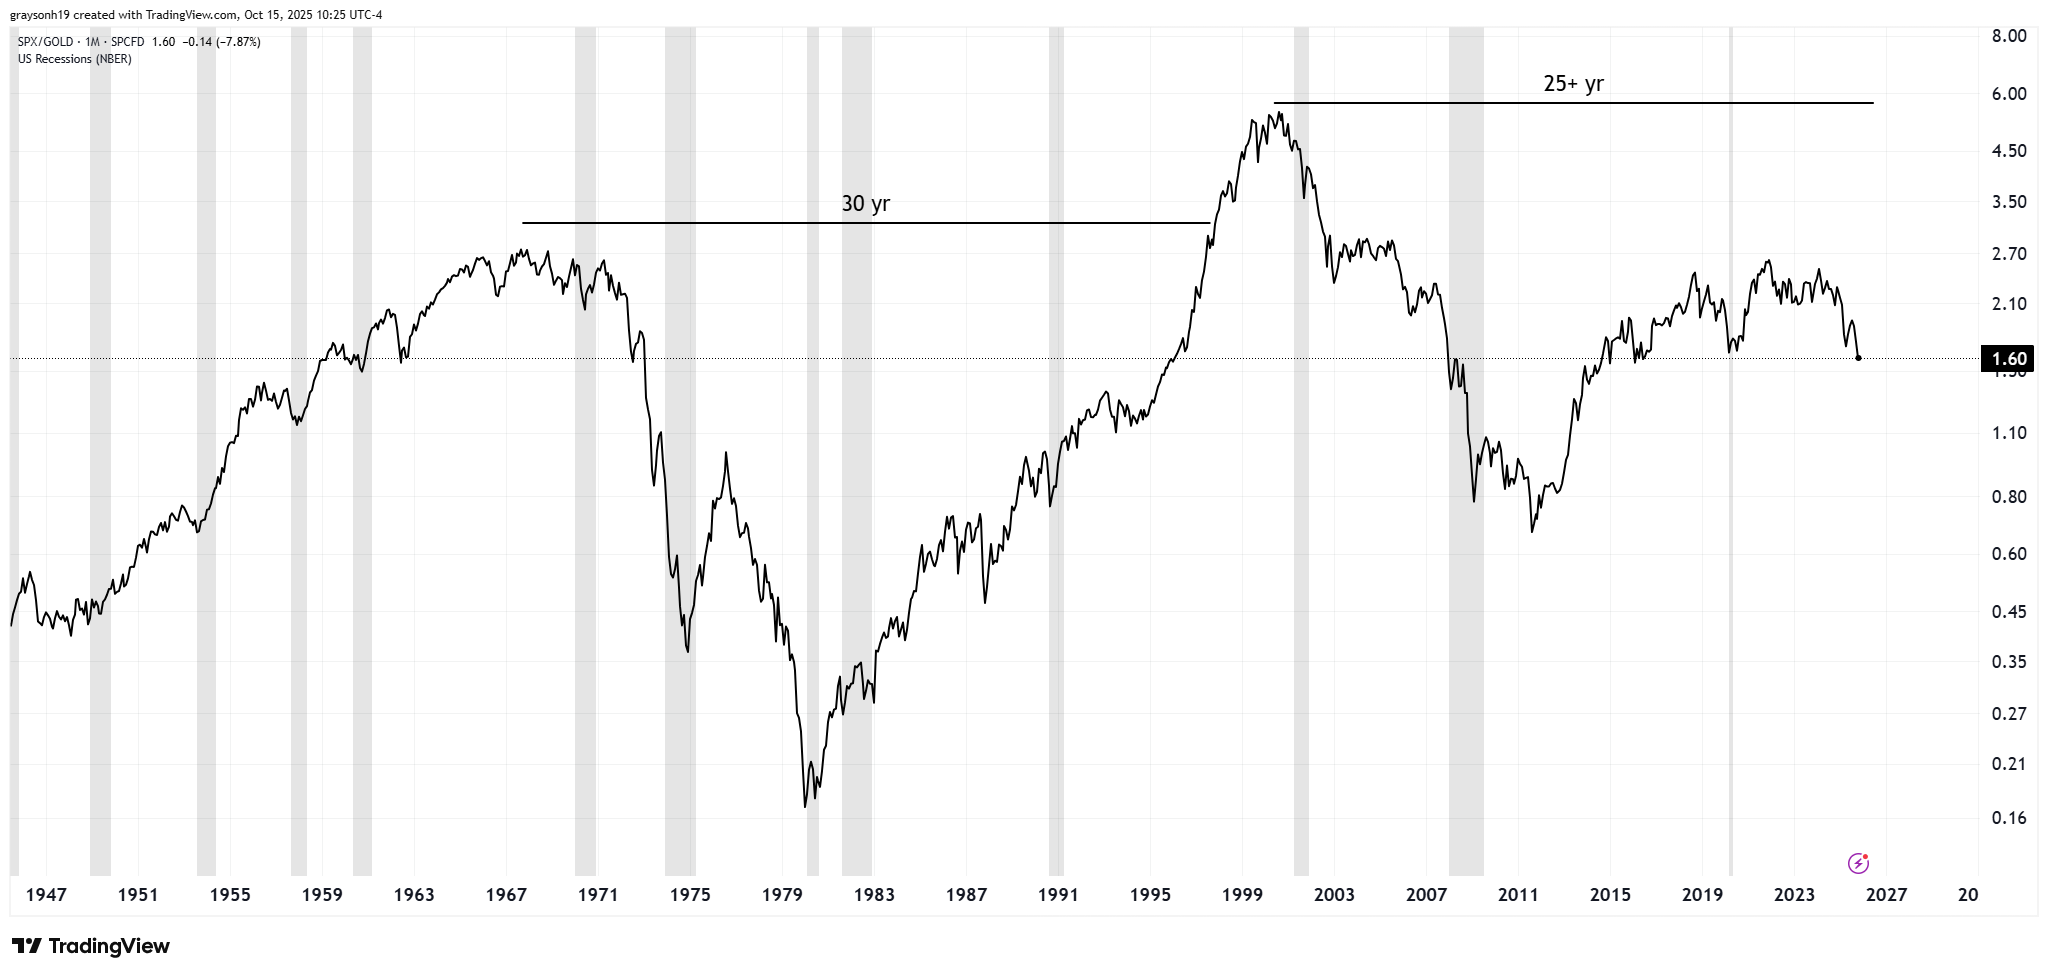
Things are bleaker yet when using gold as the unit of account. The same 30-year dead period was also in effect during the 70s. The S&P500 looks like a meme stock, going down 93% against gold during this time. Even crazier yet, stocks have yet to make a new high against gold since their 2000 peak.
Within this chart, there are times when stocks (blue line) and gold (orange line) go up together (green), both go down (red), stocks outperform (blue), and gold outperforms (yellow). What we learn from this chart is that the only time SPX/gold goes up is when gold is going down (blue). When gold is going up, it is either outperforming stocks or stocks are going down outright (one flat period: 2016-2021).
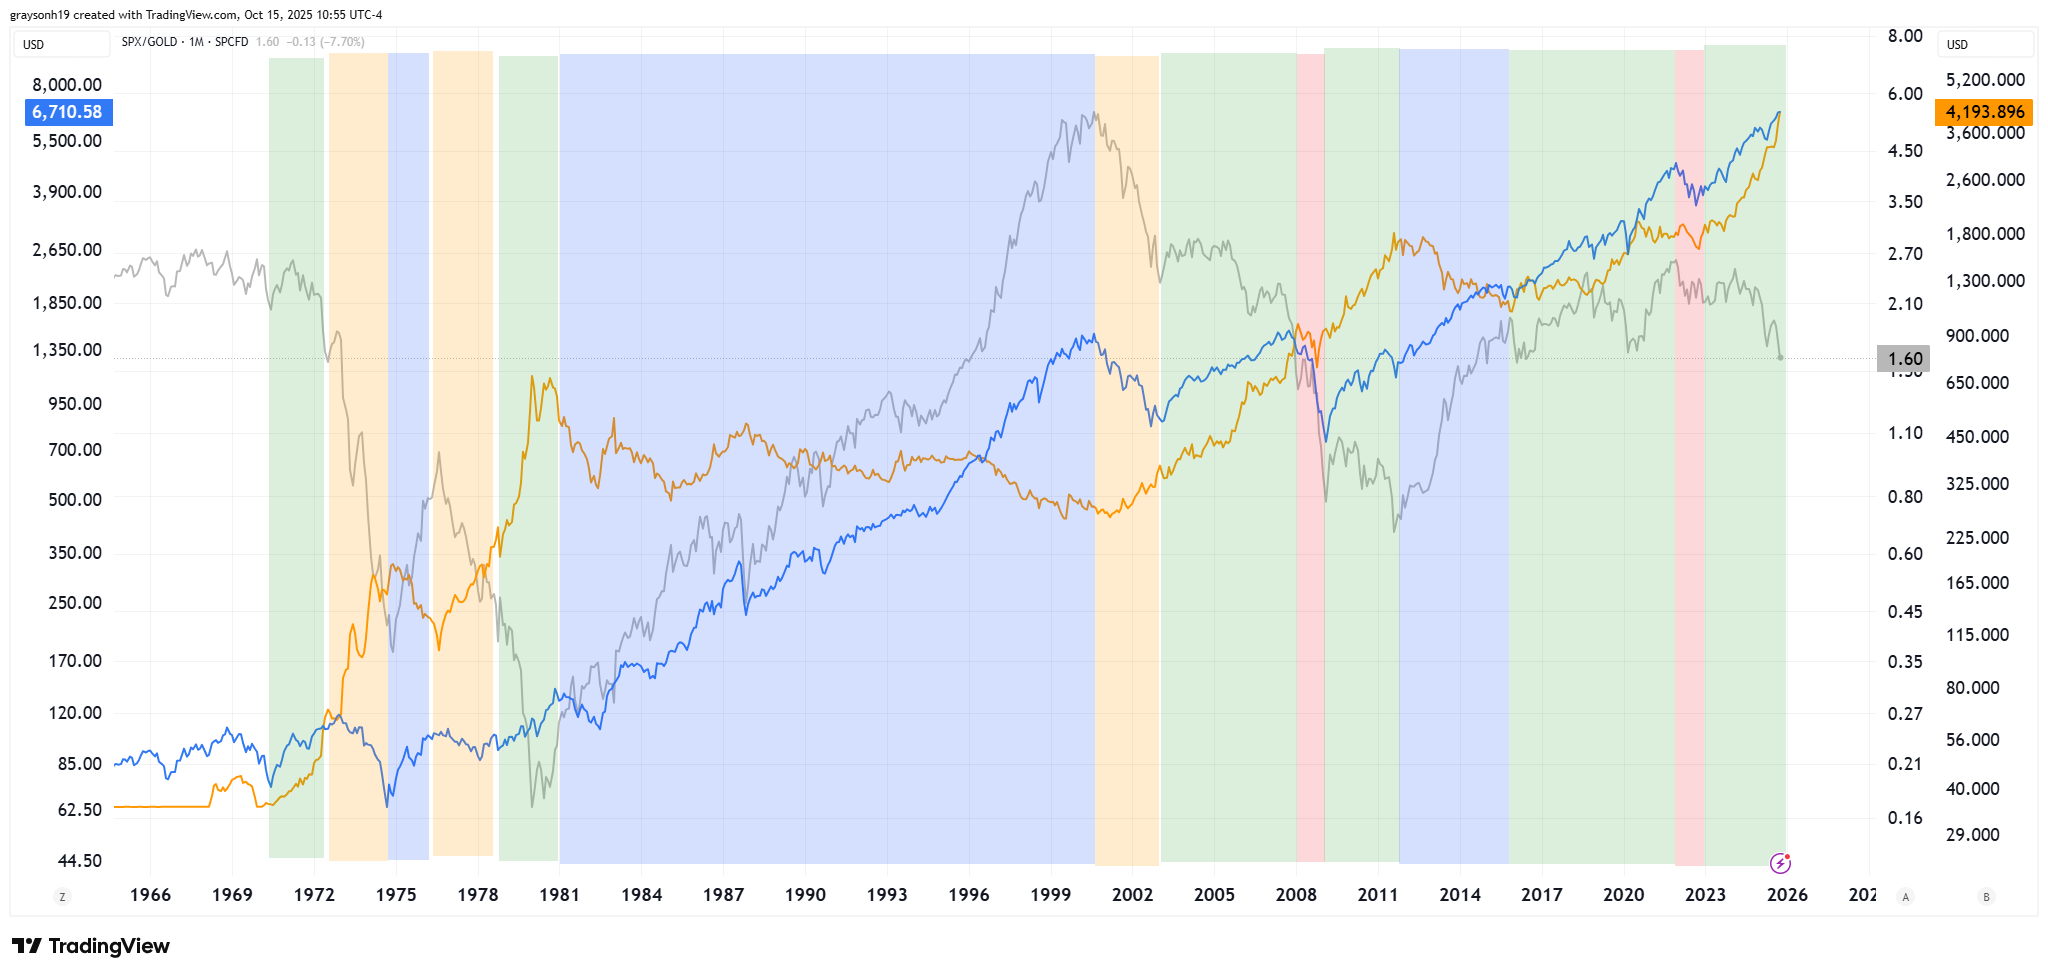
While stocks provide the best overall return going back to 1975 compared to bonds, housing, and gold, certain time periods show a preference for real assets over companies. Sometimes events cause all assets to go down, like in 2008 and 2022. Other times, gold does nothing, marked by an outperformance of the stock market.
The moral of the story is that while gold is trending up, you want to own it in the yellow rocks. Historically, gold has outperformed stocks when this happens, regardless of whether stocks are also going up.
Typical financial portfolios contain stocks and bonds, with very little exposure to real assets. Conventional wisdom says timing the market doesn’t matter in the long run. These two axioms of modern investing are heavily flawed. Long stretches of history are marked by bear markets in stocks in real terms, according to multiple methods of calculation. Avoiding these dead periods and finding assets that appreciate during this time is important to long-term financial success.
After a red spell during 2022, SPX/gold has been in a green phase where gold and stocks are going up together. Like throughout history, while SPX/gold is decreasing, gold is outperforming even while stocks are at abhorrently high valuations. Gold may be relatively expensive in the short term, but this is a time to at least consider gold and real assets in a long-term portfolio to maintain real returns on capital invested.
-Grayson
Socials
Twitter/X - @graysonhoteling
Archive - The Gray Area
Notes - The Gray Area
Promotions
Sign up for TradingView
The fact that gold and silver are making parabolic moves of late is a little concerning (compared to the nice paced trudging up the previous years). It may just be because it has been 'discovered' by the masses but things that move higher fast can fall just as fast too. Plenty of uncertainty in the global economy to justify gold going higher but often if stocks crash gold soon gets sucked down with them. If things are really bad (defaults, war deleveraging, and such) then gold could race to the moon even if temporarily taking a dip. Chris Vermuelen at Technical Traders was thinking there was some more room at the top but there might be a shakeout in a few weeks. Great time to be owning it but it's had quite a run.