
No Distress
How to use junk bond credit spreads as a market timing strategy.

If you find this article interesting, click the like button for me! I would greatly appreciate it :)

What if there actually was a way to tell if a recession was imminent? Typically, recessions don’t get bad until consumers and companies start defaulting on loans and going bankrupt. This credit risk is priced on a whole spectrum based on how risky the loan is. On the consumer side, Sally, with a high income and credit score, will get favorable interest rates over Bob, who has a low income and a poor credit score. It is the same for corporations, which is why Apple is given a higher credit rating than GameStop.
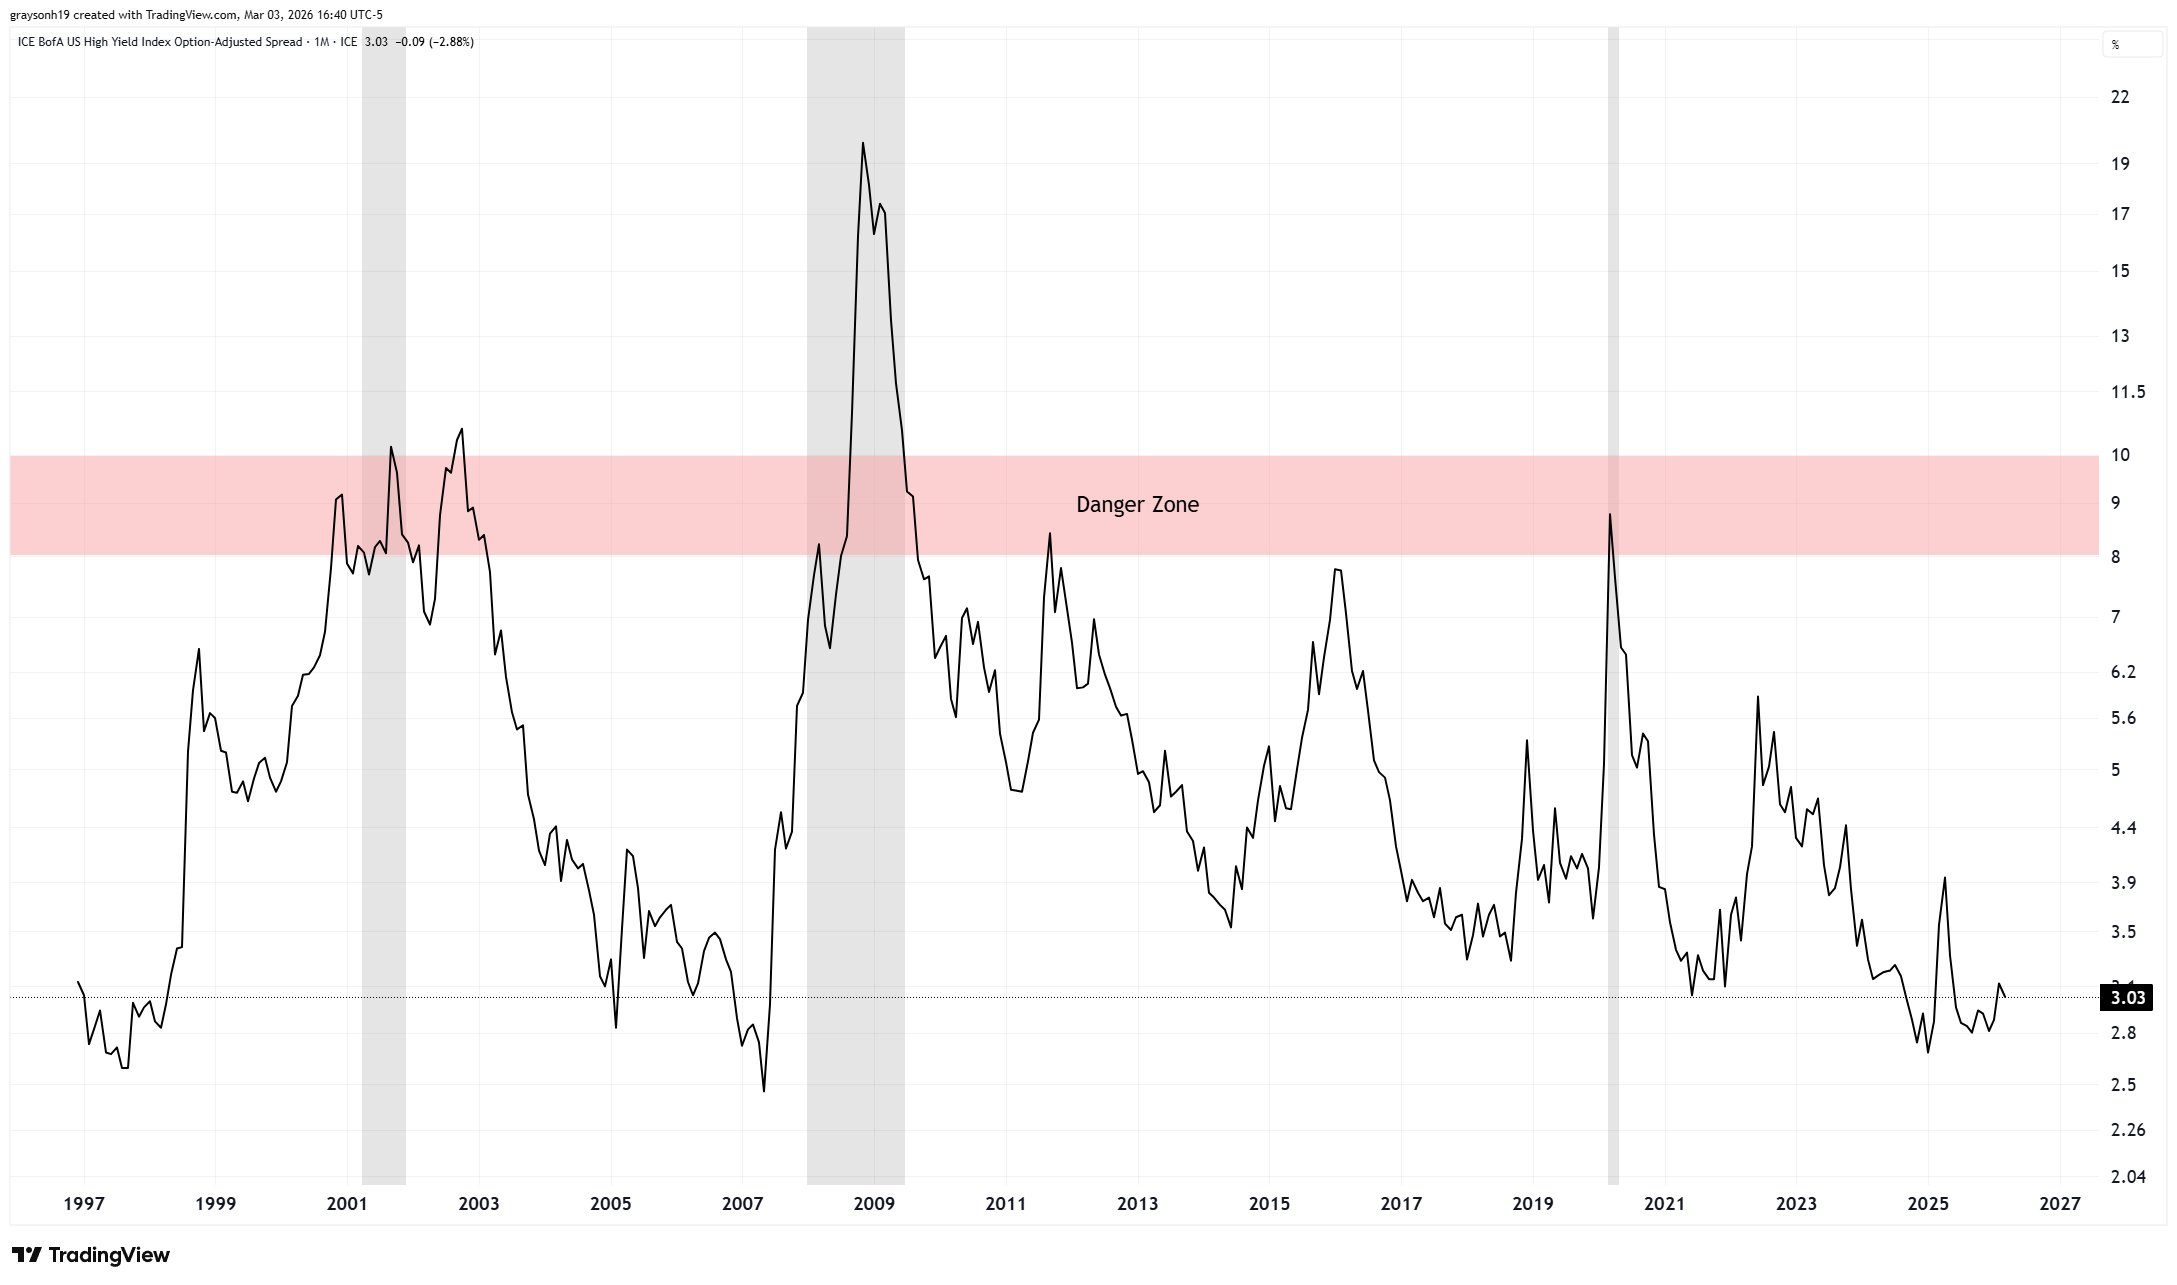
The safest loan is a treasury bond from the US government, followed by Apple (AA+), then Gamestop (B/B-). Credit spreads indicate the difference between the interest rates charged for different borrowers. The spread between a treasury and a non-investment grade/junk bond (BB or lower) can give interesting information about the health of the economy.
In a booming economy, a 10yr treasury could pay 4%, whereas junk bonds 7%. Naturally, you are paid more for taking on greater risk. If the economy is struggling, the 10yr treasury could go down to 3%, whereas the junk bond goes to 20% as investors don’t trust these companies to pay them back. The spread between treasuries and junk bonds is shown below, and when the spread goes over 8%, it is the danger zone. These are times associated with financial distress, Federal Reserve intervention, recession, and/or significant market volatility.
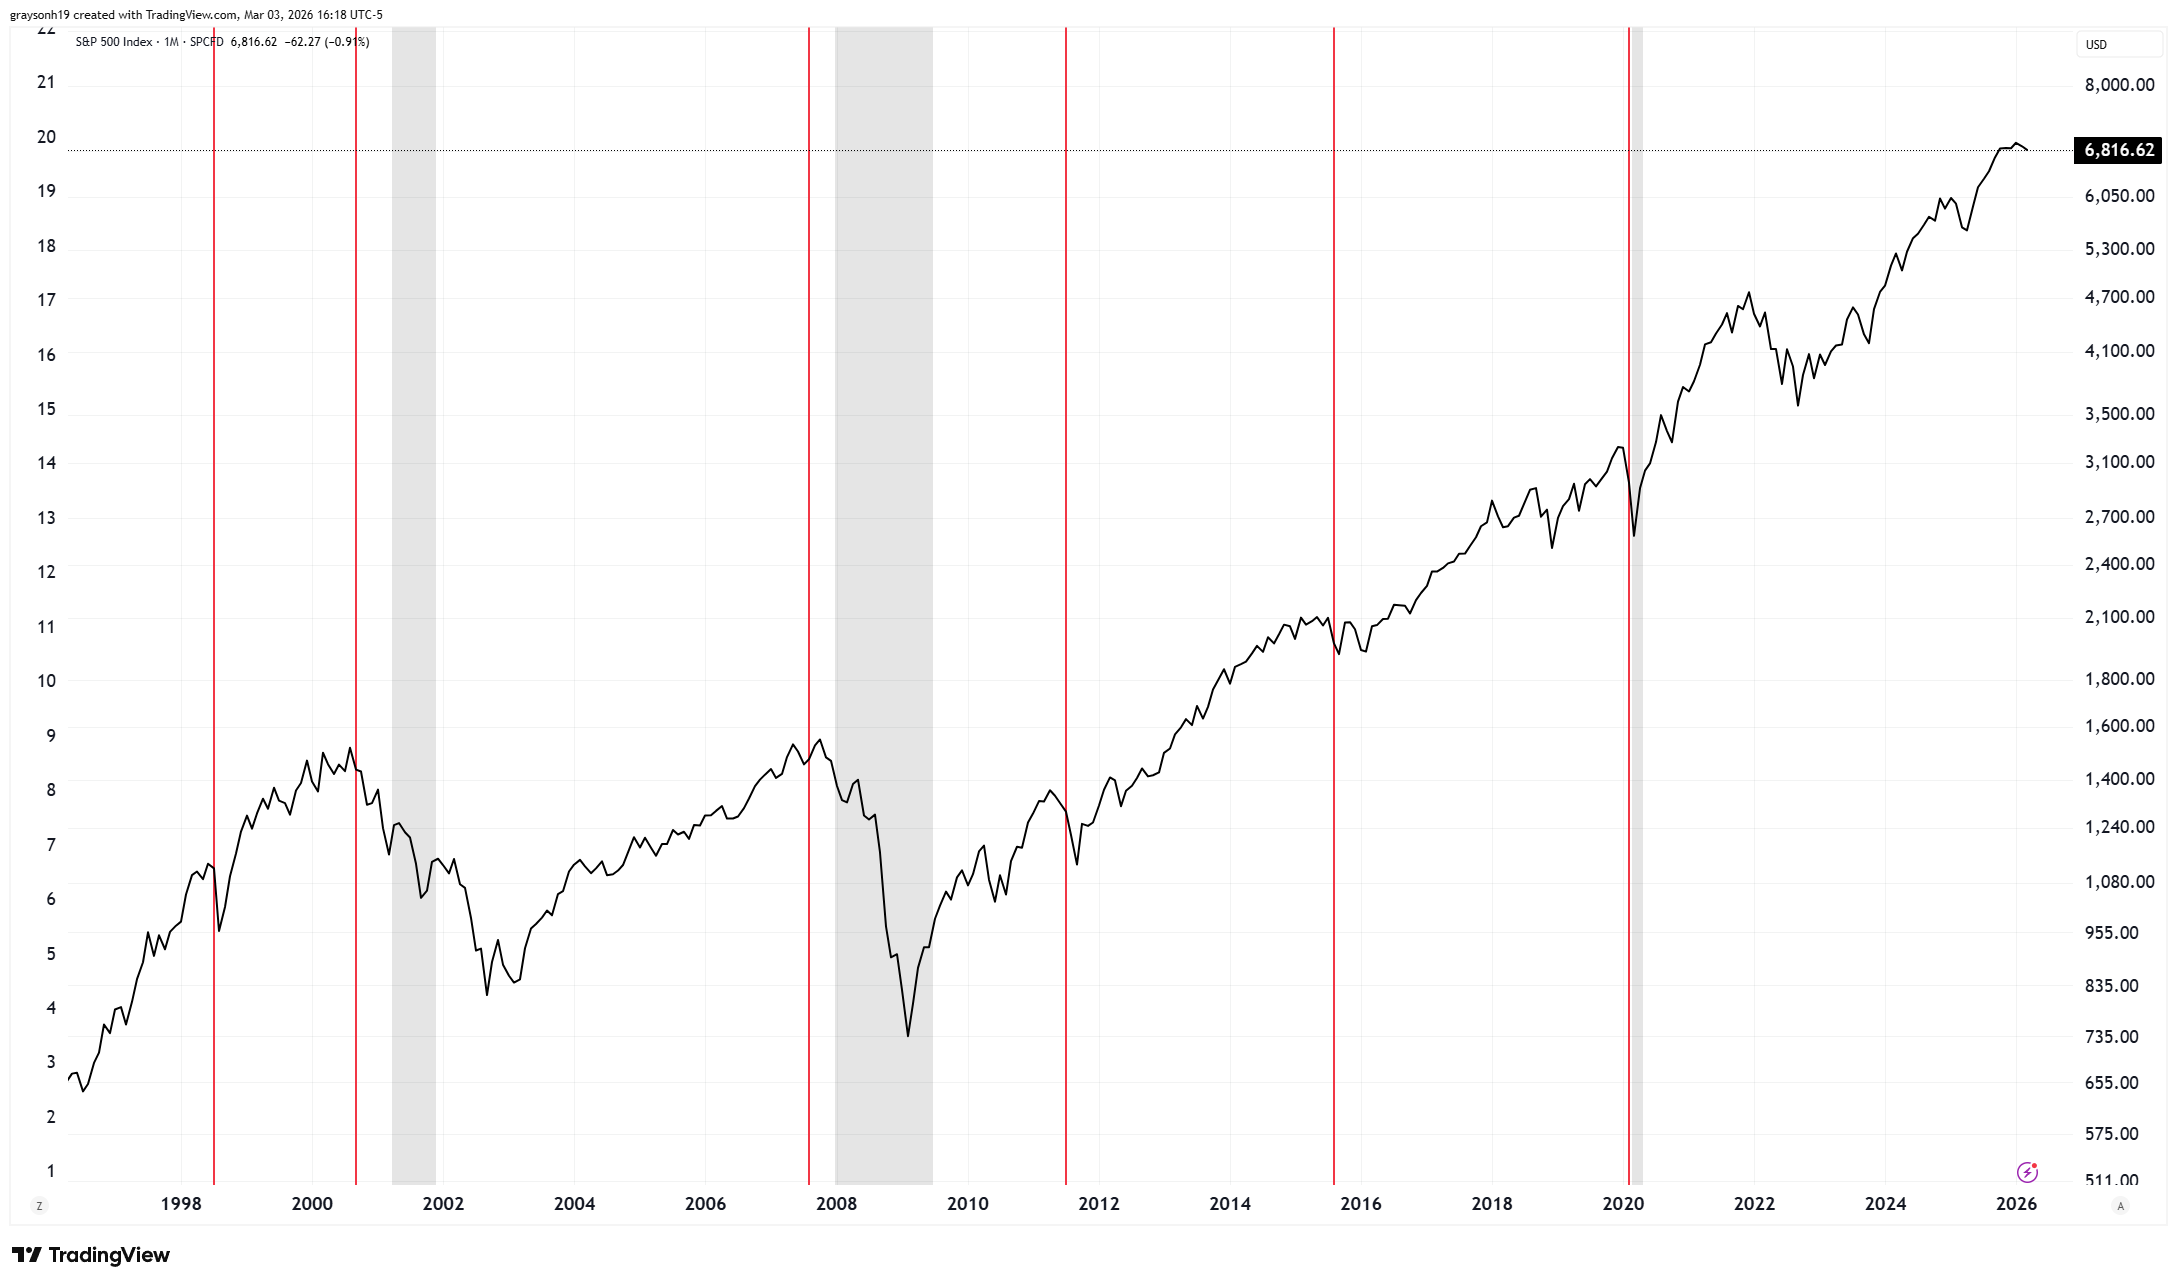
Credit spreads can be used as an indicator to get out of the market. To avoid false signals, the red line represents a 2% surge in credit spreads, indicating substantial weakness. These signals typically occur at market tops or during corrections. For smaller moves/corrections during the mid-business cycle, the signal may be less obvious. However, this signal would have gotten you out of the market at the dot-com and 2008 market peaks.
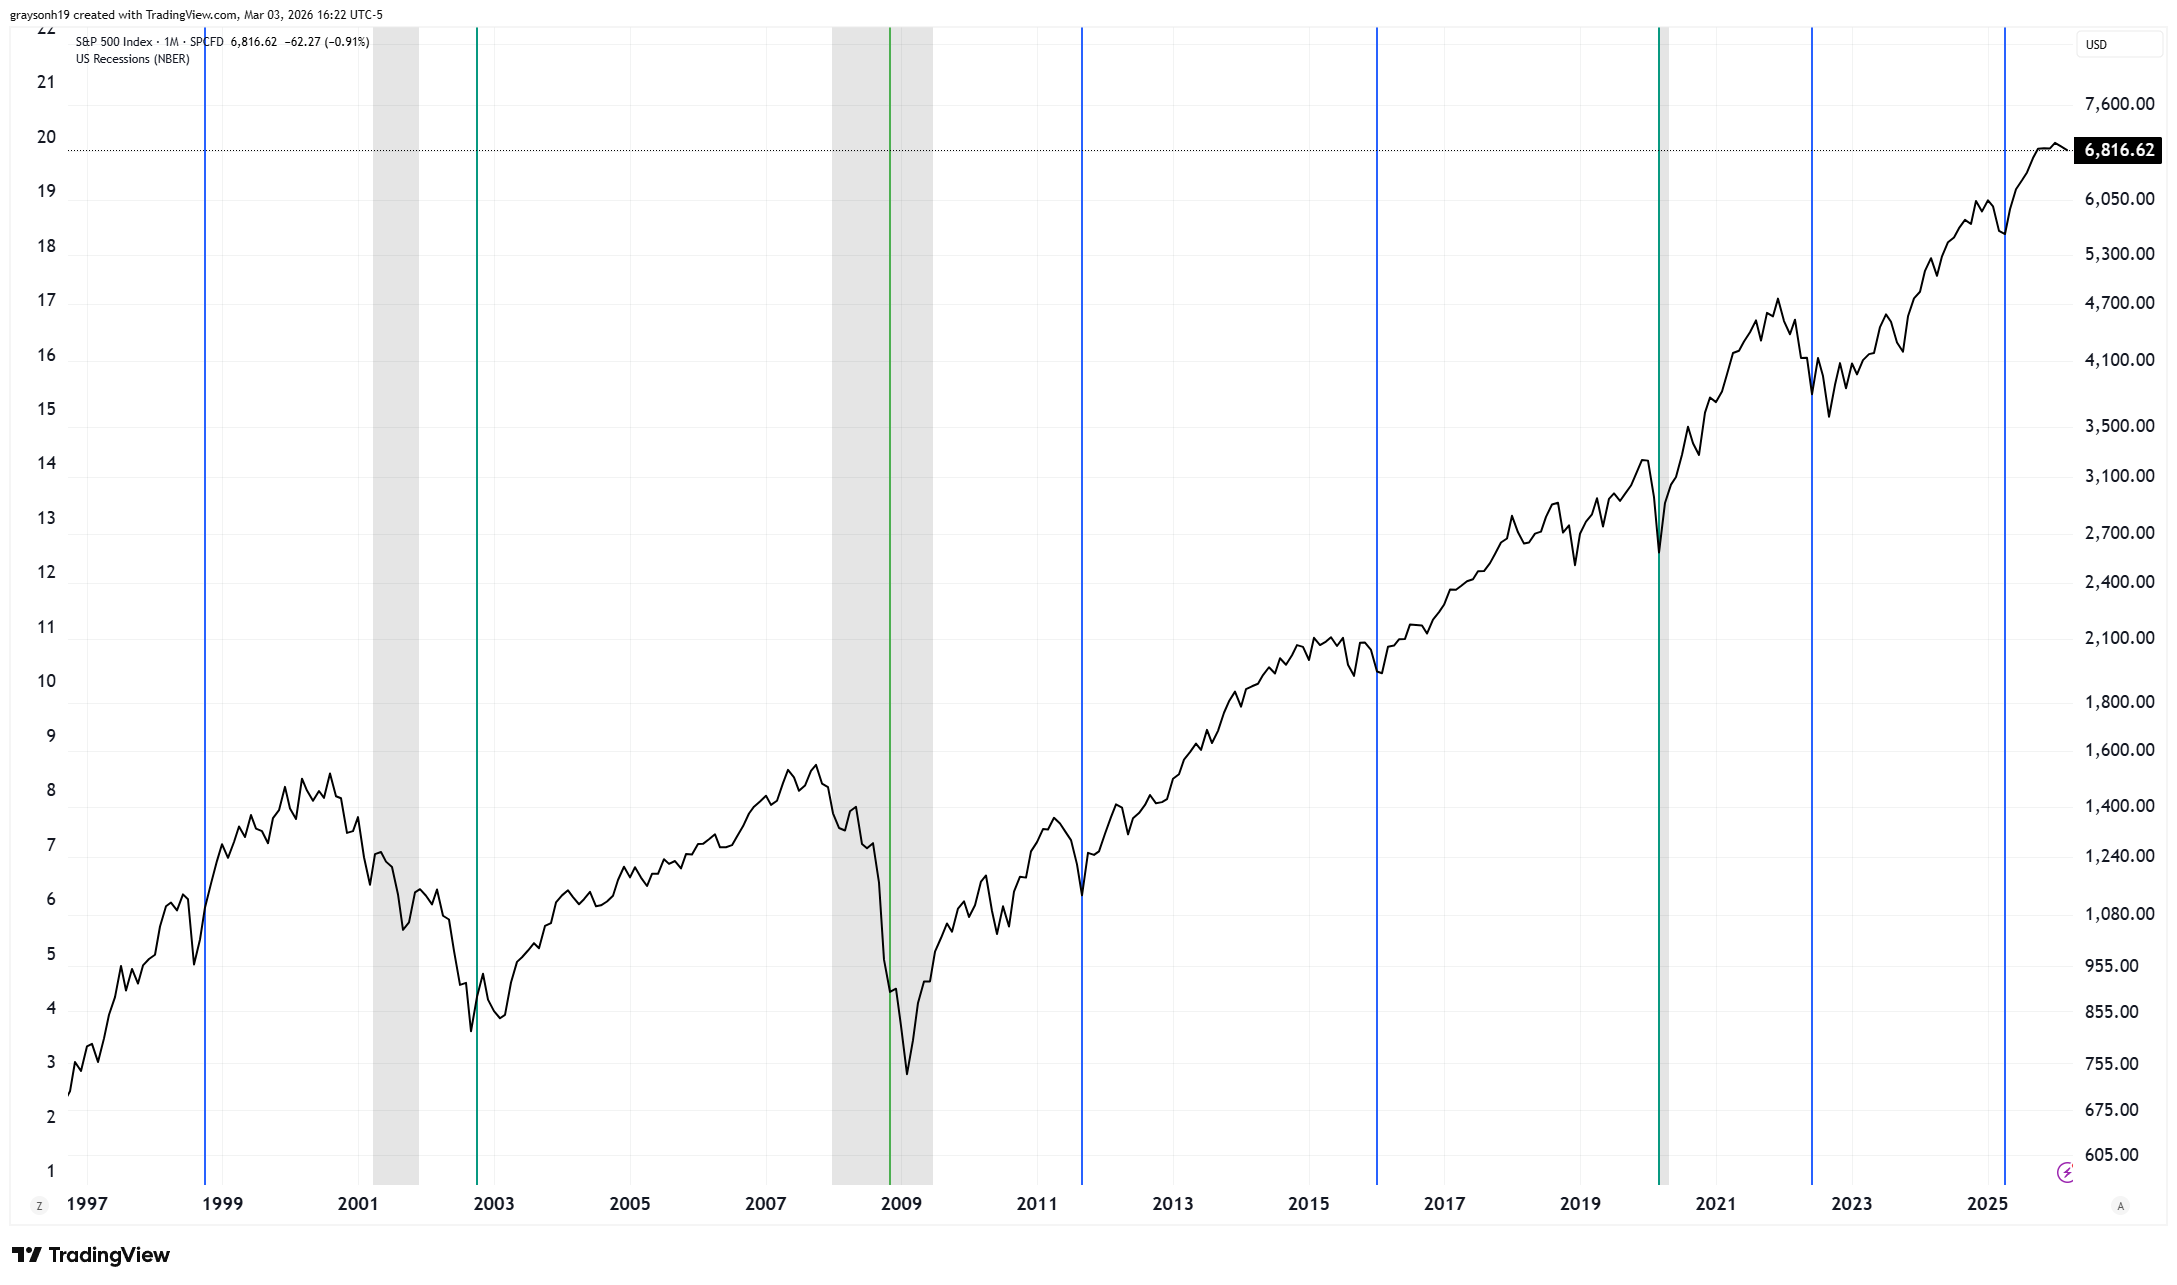
On the flip side, the top in credit spreads often shows the end of the weakness and market bottoms. These signals typically occur at or near market bottoms. In a world where it is extremely difficult to call tops and bottoms, these indicators can be useful for getting you close. The blue is a smaller mid-cycle spike, while the green is a major credit spread spike, coincident with recession.
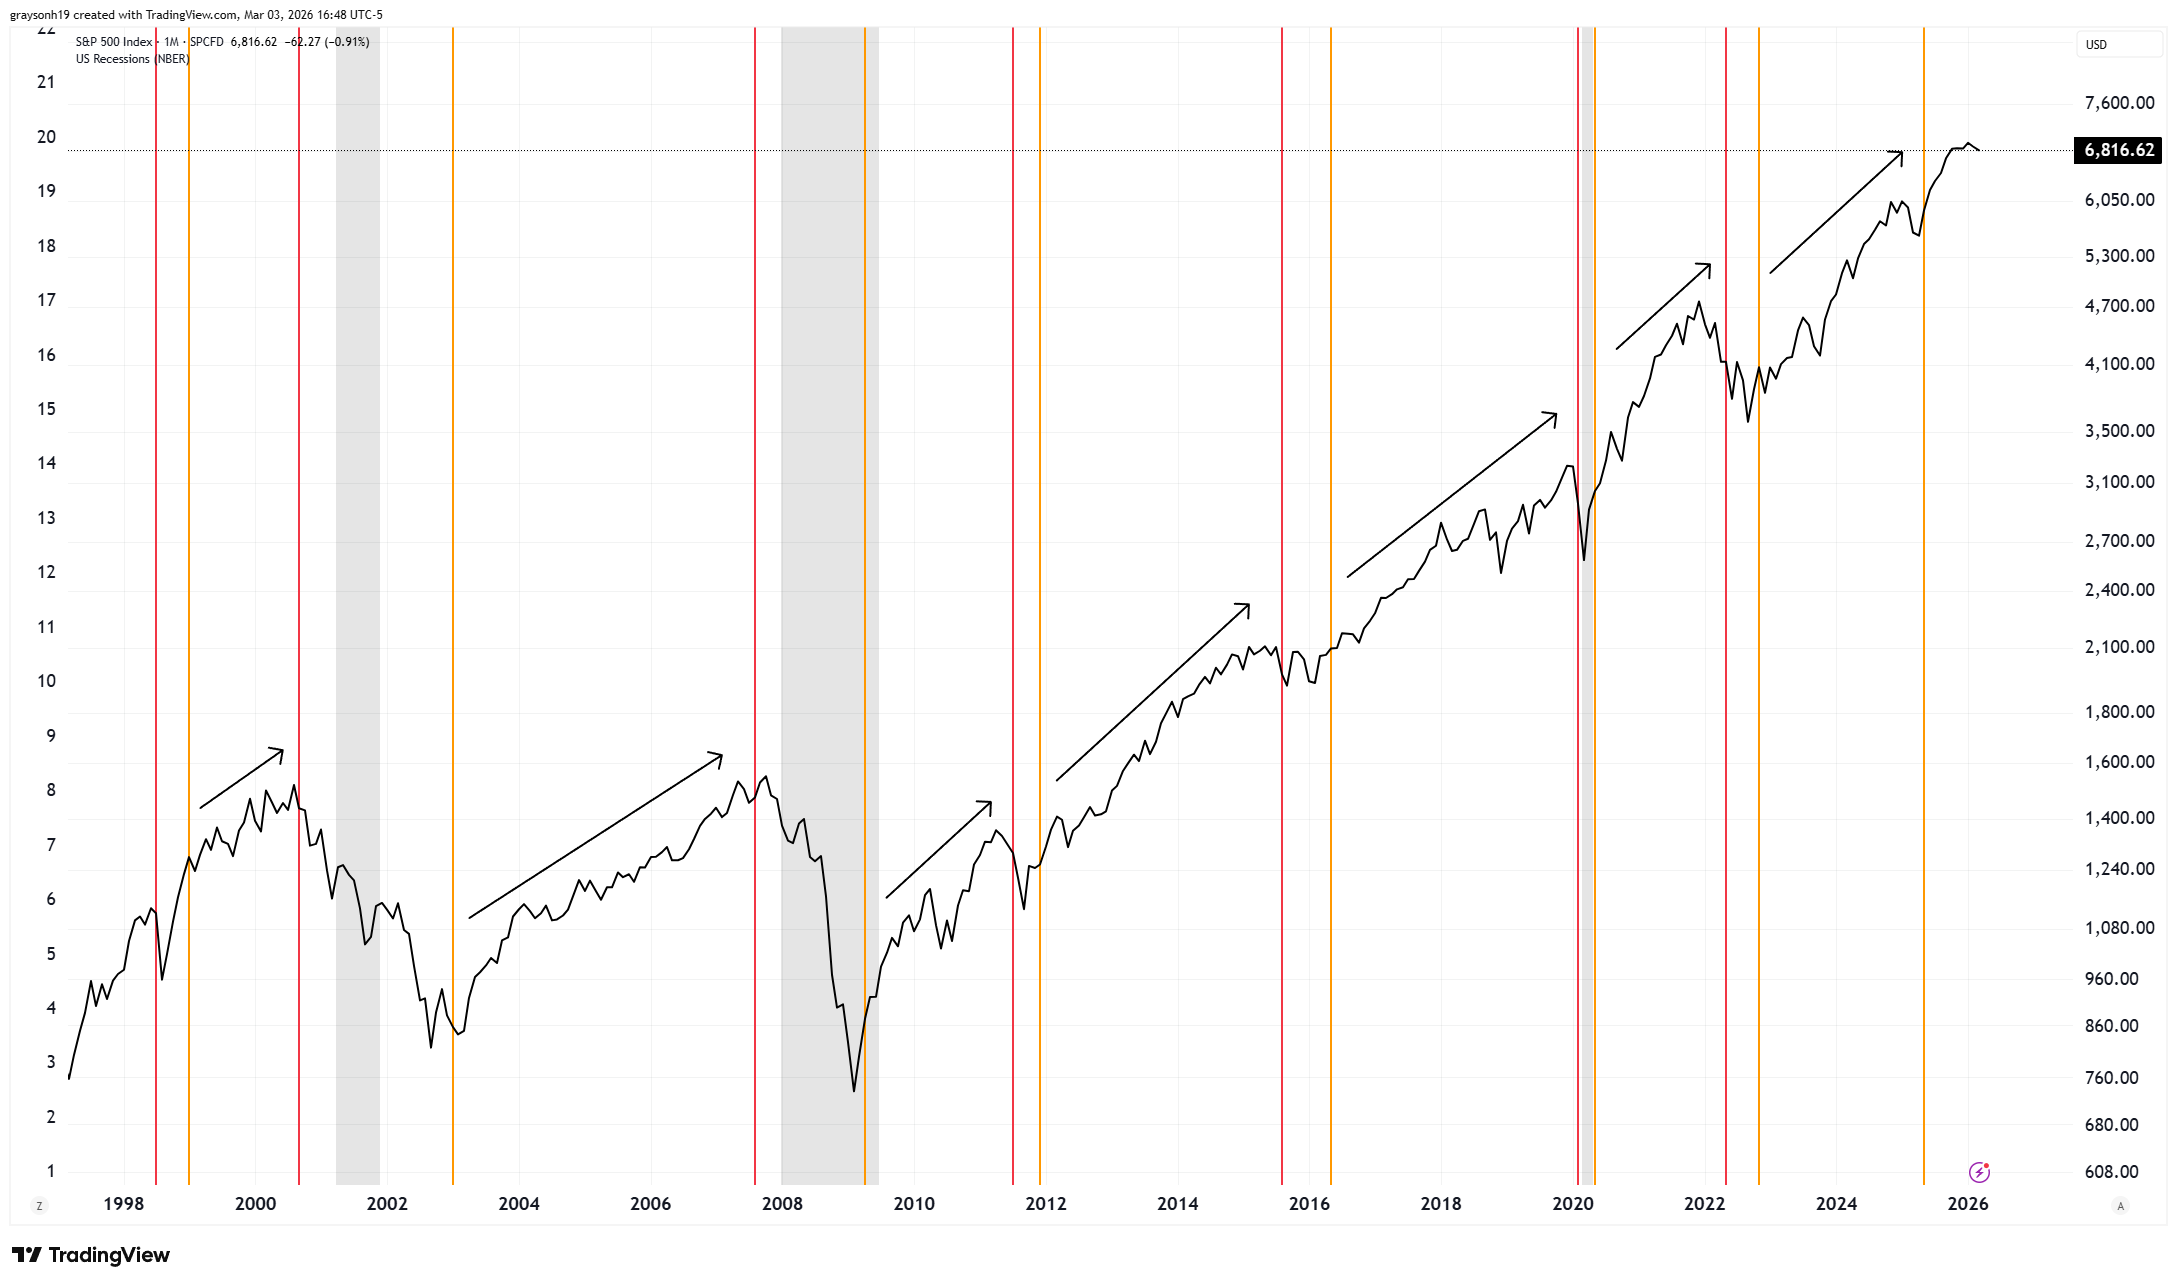
Obviously, you’re not going to know that credit spreads have peaked and turned down either, so we can place another line when credit spreads retraced 40% of the move higher, providing evidence of a trend reversal into favorable economic conditions. The orange signal basically gives you confidence that the worst is over. Each past orange signal has resulted in favorable stock performance until the next red signal (2% credit spread thrust). You also don’t miss out on too much return off the low either.
Typically, when credit spreads move, they move fast. Caution is still warranted given other factors that lead me to be cautious, such as technicals, leading indicators, labor market fundamentals, yield curves, consumer credit, overvaluation, etc. However, right now, credit spreads are very low, meaning there is little risk priced in (may be surprising). Until that changes, the stock market can continue doing well (or at least not crashing). My gut tells me we get more highs in the S&P 500 before a recession starts, but I could be wrong.
I will be watching credit spreads closely. Once we get another red signal, where credit spreads widen by over 2%, that will warn me that the top for stocks could be imminent or in the past. This will impact things like the model portfolio and serve as a warning to investors of looming labor market and stock market weakness.
-Grayson
Socials
Twitter/X - @graysonhoteling
Archive - The Gray Area
Notes - The Gray Area
Promotions
Sign up for TradingView
Interesting, thanks!