
Oh Kay
Corporate America has never been more profitable, but the math behind those profits reveals something the market isn't pricing.

If you find this article interesting, click the like button for me! I would greatly appreciate it :)

Every few years, a crisis arrives and narratives reshape. The pandemic, regional bank failure, inflation shock, trade war, closure of the Strait of Hormuz. Each one was supposed to break something. Each time, the market recovered to new highs within months. By now, the pattern is so well-established that most investors have stopped questioning it.
The reflexive buy-the-dip psychology that was the best investing strategy over the last fifteen years rests on a foundation that is quietly crumbling. We can’t merely look at the stock price, but at the corporate profits and what’s been driving them.
The Numbers That Don’t Add Up
Warren Buffett once said in 1999: “In my opinion, you have to be wildly optimistic to believe that corporate profits as a percentage of GDP can for any sustained period hold much above 6%.” That statement was made months before the dot-com bubble peak, in which price took 13 years to resume higher from that quote. Today, corporate profits stand at 12.1% of GDP, double Buffett’s ceiling.
To put that in historical context: for most of the postwar era, profits as a share of GDP bounced between 4% and 8%. The long-run average since 1947 is 7.4% and post 2010 average is 10.8%. We have been running well above that average for over a decade, and the market has come to treat this as the new normal.
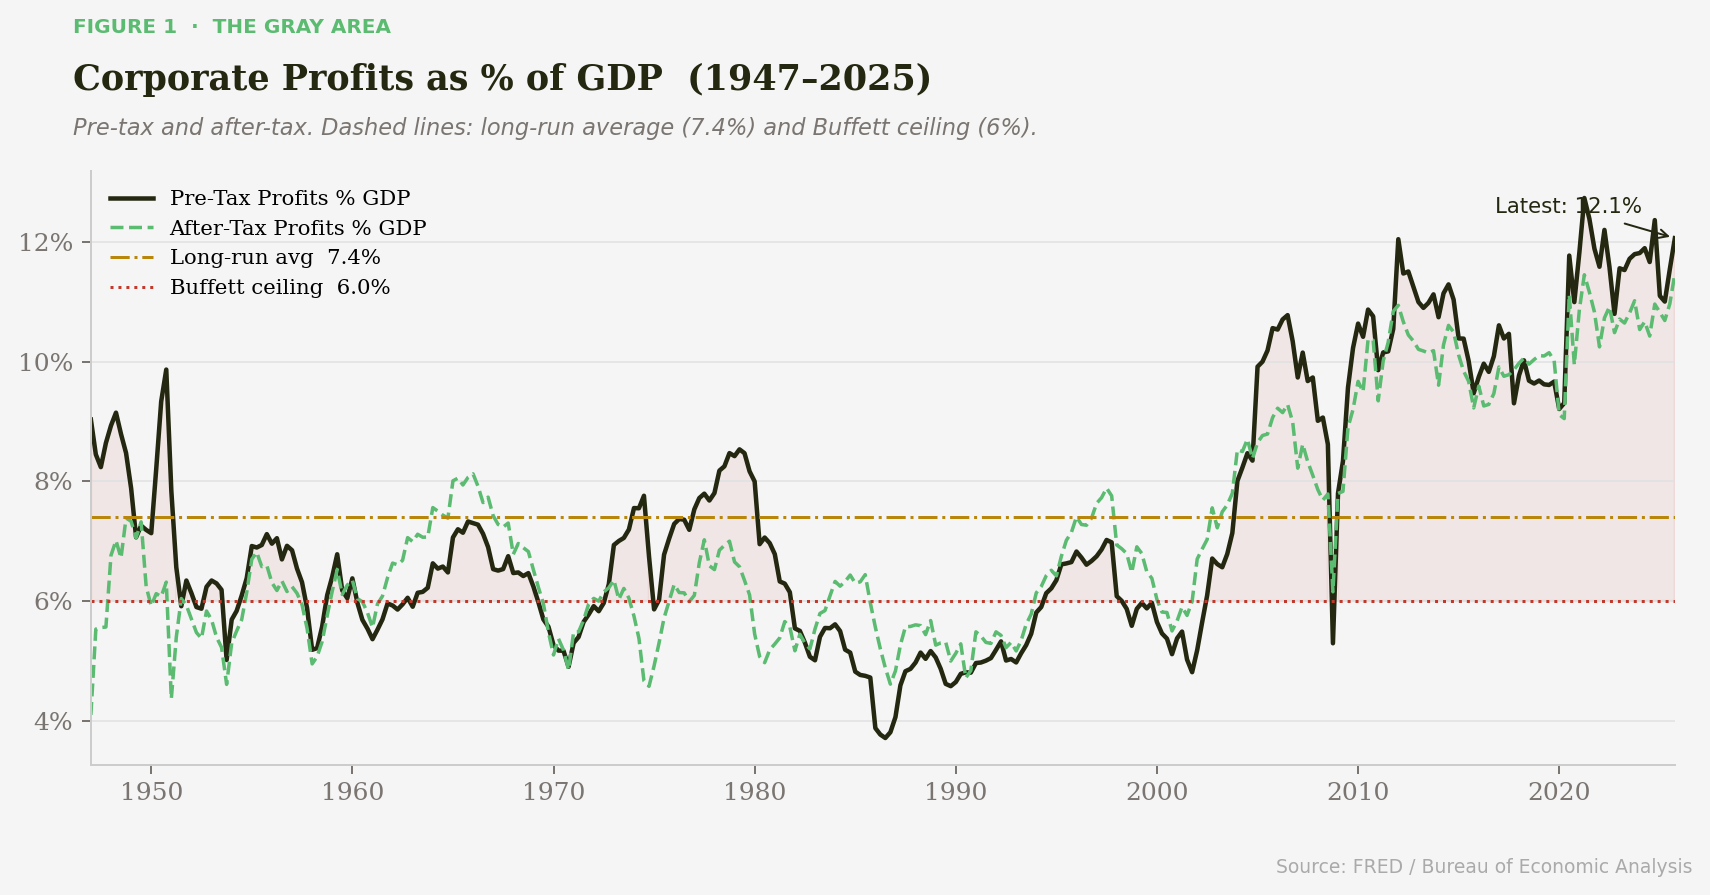
Corporate profits are clearly high, but the important question is why, and for how long.
The Mechanism Nobody Talks About
Most analysts explain elevated profit margins through the lens of technology, globalization, and operational leverage. While real, they are secondary to something far more structural: the Federal Reserve and unprecedented fiscal regime.
Since inception, the Federal Reserve (like any good government agency) has had mission creep. Founded to provide bank stability, it is now a backbone of the global economy. 2000 dot-com bubble paved the way for modern intervention, but the 2008 Financial Crisis was a step change. Zero interest rates, liquidity injections, bond duration manipulation with the treasury, etc.
Money enters the financial system through large banks and flows disproportionately to large corporate borrowers. The Cantillon Effect suggests that those closest to the money receive most of the benefit. Corporations are closer than consumers, thus subsidizing corporations relative to labor. The bailouts are always corporate-first, with the Fed has going as far as buying corporate bonds in 2020.
Kalecki Profit Equation
Profits = Investment − Household Saving − Government Saving − Foreign Saving + Dividends
This equation is an underappreciated macroeconomic tool. When the government runs a deficit, the money has to show up somewhere in the economy (corporate profits).
The United States has run structural deficits averaging 5–7% of GDP for most of the post-2008 era. Those deficits did not just “stimulate the economy” in the abstract. They mechanically subsidized corporate profits.
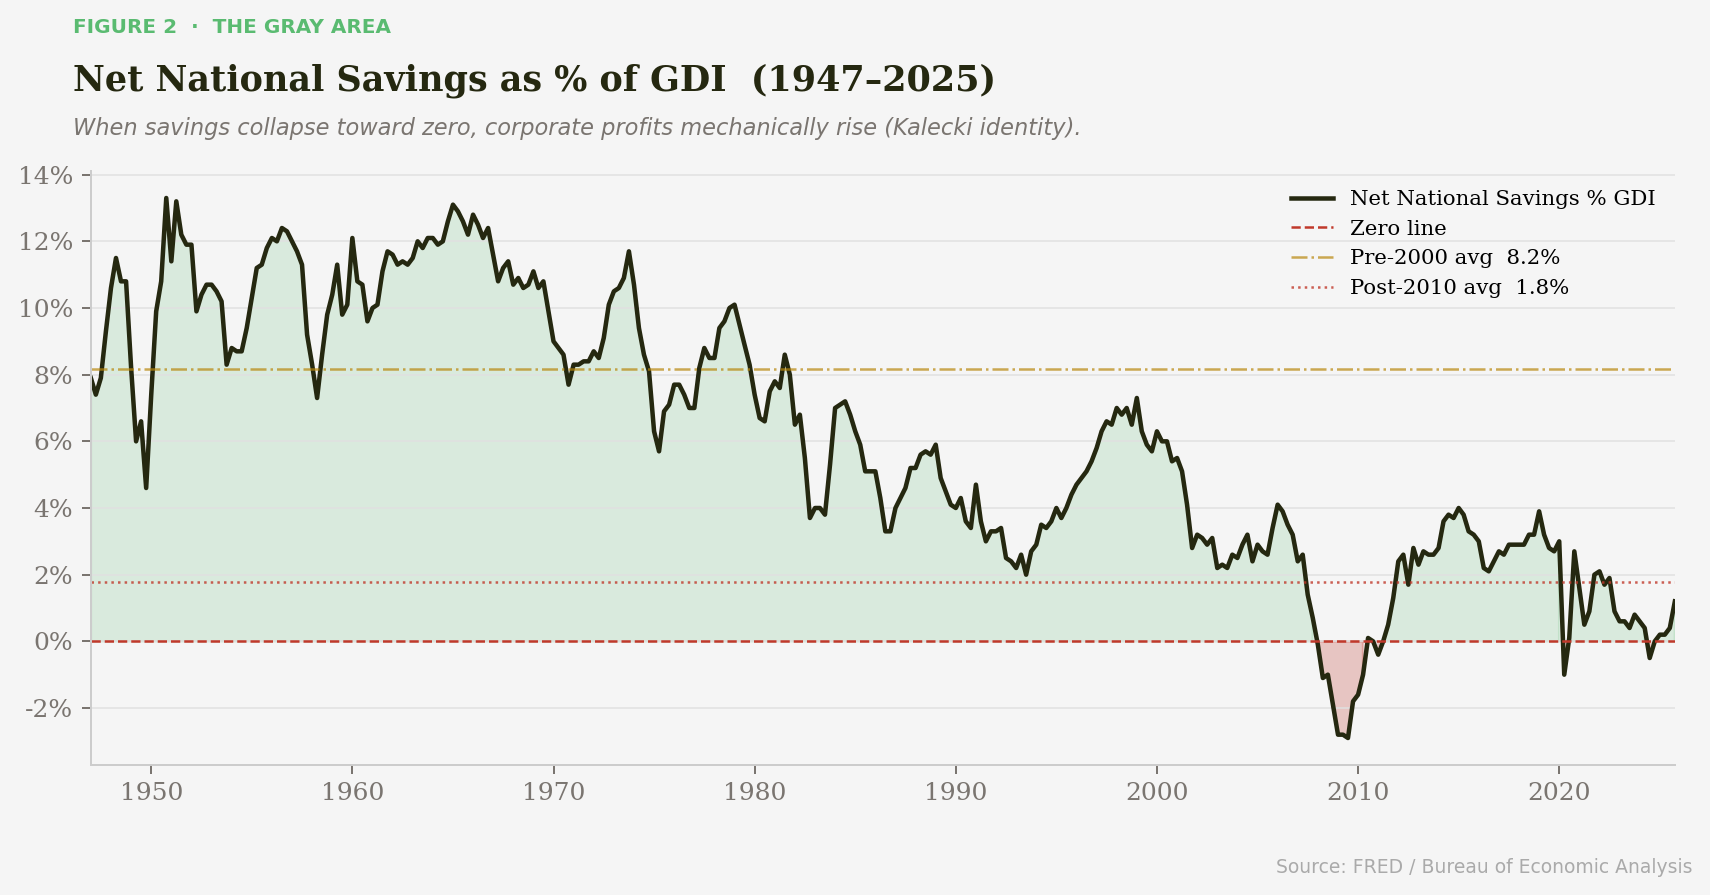
We know the government is heavily indebted, but so are corporations and consumers. The net national savings measures a nation's net saving relative to its total income, (representing funds available for investment). For most of the post WWII era, the economy saved at 8.2% of GDI, but since 2010, it has averaged 1.8%.
Zero national savings has only occurred in the Great Depression, 2008 Financial Crisis, and now. It means the economy is consuming everything it produces and then some. In the Kalecki framework, this is peak profit extraction. It is not a sign of economic health, but peak structural dependence with little room for growth.
At Whose Expense?
Every dollar of GDP that flows to corporate profits must come from somewhere. The data tells us the unfortunate reality, it came from wages. Queue the rise of populism
In 1970, wages and salaries represented over 51% of GDP. Workers earned the majority of what the economy produced. By 2026, that figure has fallen to 41.9%. Meanwhile, corporate profits have risen from roughly 5% of GDP to over 12%.
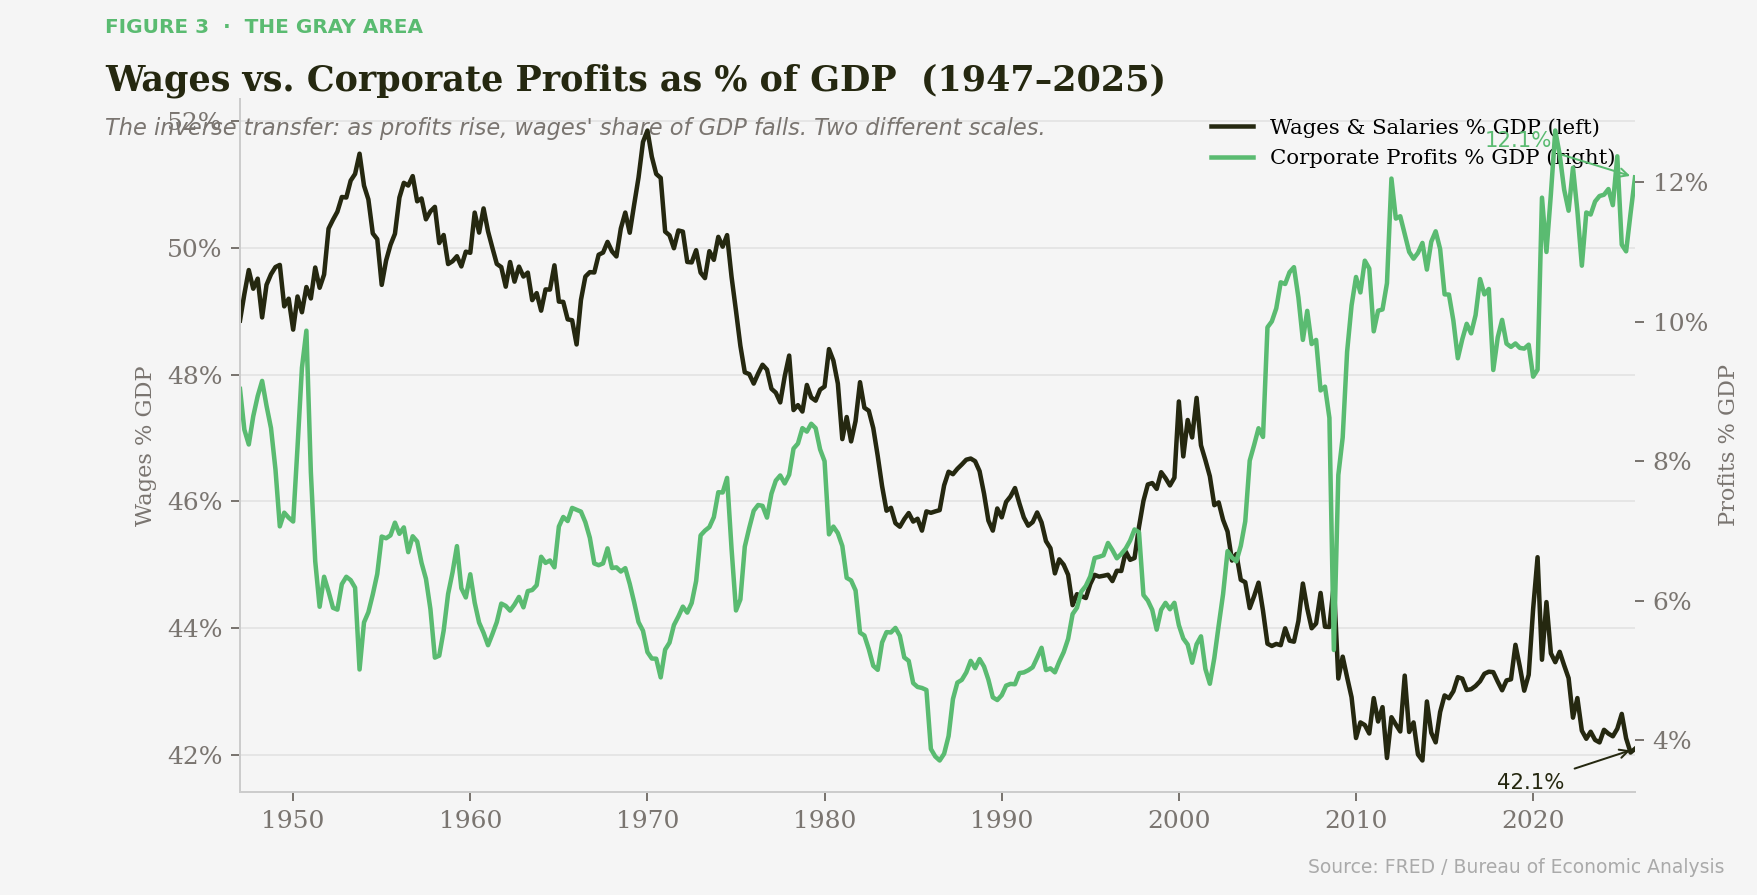
This is the structural divergence is what people are now calling the K-shaped economy. Those closest to corporations and own assets are benefiting at the expense of labor. Sentiments like Man North of Richmond, calls to tax the rich, and even Trump’s election are natural consequences.
Globalization arbitrage of cheap labor and manufacturing, rise of corporate stock buybacks, and supply constraint pricing power are all additional factors which have further supported corporate profit margins.
The share of economic value ebbs and flows over time through conflict, social change, economic change, and political change. Regardless of what combinations may arise, the series is not static. Consumers are nearly tapped of credit and savings. This well is running dry, leaving the government to pick up the slack. Social unrest and political extremism during the 1930s followed an economic crisis when this happened before.
Why Estimates Are Rising Anyway
Against this backdrop, analyst earnings estimates for 2026 have been revised upward in a manner that is, by historical standards, genuinely unprecedented. Analysts are all of a sudden more optimistic on earnings now than every before, by a lot.
Earnings are exceptional for the MAG 7 “AI” stocks, and these estimates actually make sense based on recent growth trends. The S&P 493 is not doing much of anything, but the earnings estimates have also been pulled up, which makes less sense. Earnings and GDP are largely being driven by the immense datacenter capex buildout.


The MAG 7 stocks make up 35% of the S&P 500. If their earnings are to continue, you can argue that there is nothing to worry about.
The Reversion Triggers
The sustainability question has two components: can corporate profit margins remain elevated, and can valuations hold given those margins?
For corporate profits, we are relying on the healthy data center capex, government spending, and consumer spending. The S&P 493 we already know is not likely to magically deliver unprecedented earnings which is the first bullet. Second, data center capex in many areas are facing trouble. Third, the liquidity cycle topped in late 2025 meaning monetary conditions may get tighter reducing some benefit on the government side. Fourth, consumer sentiment, savings, and credit delinquency is weak, showing a struggling consumer piece. I am skeptical of the rosy earnings estimates.
Second, the valuation of a company is the price to earnings ratio (P/E). If investors are optimistic they can pay more for given earnings. If the company earnings rise faster than expected, the valuation is lower because of the ratio. Adjusting the ratio for profit margins(MAPE), the story gets even crazier. Now, the valuation investors are paying is higher than the 1929 and 2000 bubbles. Even after a brief reprise in 2022, there has yet to be true mean reversion in the series.

Conclusion
The K-shape economy is real. Consumers are taking a smaller share of every economic dollar over time. This value is being passed to corporations in the form of higher profit margins. The net national savings and our knowledge of the Kalecki equation show us that mechanically the savings of governments, corporations, and consumers is flowing into corporate profits.
I am optimistic that AI will make the world a better place, and could even see how it can boost profit margins by reducing labors share of GDP further. However, the dot-com bubble shows us that even transformative technologies evolve in unpredictable ways, aren’t immune to valuation mean reversion, and take take longer than expected to sort out.
Not only are earnings at risk to mean revert for numerous reasons, the valuation metric (what investors are willing to pay) is also bound to mean revert. Timing is the big challenge, but the risk in the S&P 500 is unprecedented and would be foolish to ignore.
-Grayson
Like to see these asymmetric opportunities synthesized into a real model portfolio that beats the S&P 500 and avoids major downside risks?
Socials
Twitter/X - @graysonhoteling
Email - thegrayarea55@gmail.com
Archive - The Gray Area
Notes - The Gray Area
Promotions
Sign up for TradingView
For educational and entertainment purposes only. The Gray Area should not be taken as financial advice.