

If you find this article interesting, click the like button for me! I would greatly appreciate it :)

Sometimes in the media you hear things like, “September is seasonally bad,” or “sell in May, go away.” Another one is that mid-term election years tend to be choppy and poor for returns. We have already had a volatile year, with a 9.5% correction in February/March, followed by one of the most aggressive 20% rallies in history, followed by another 5% correction, and now back to highs. It has been volatile, but largely positive so far in 2026, up ~12%.
Is that early-year correction all she wrote, or is there room for weakness before mid-terms in November?
Midterm Election Years
Mid-term election years are actually worse than normal years going back to 1930. Midterm years averaged +3.2% (median +0.6%) vs. +9.5% (median +12.4%) for regular years. On top of that, midterm years averaged max drawdowns of -21.1% (median -20.3%) vs. -15.8% (median -12.2%) for regular years. Bigger corrections and worse full-year performance.
Only 54% of the time the full year finished positive, compared to 70% for other years. Outside the great depression and WWII, these have been buy-the-dip moments. For all the years, it shows attractive average next 6-month returns of 11.4%.
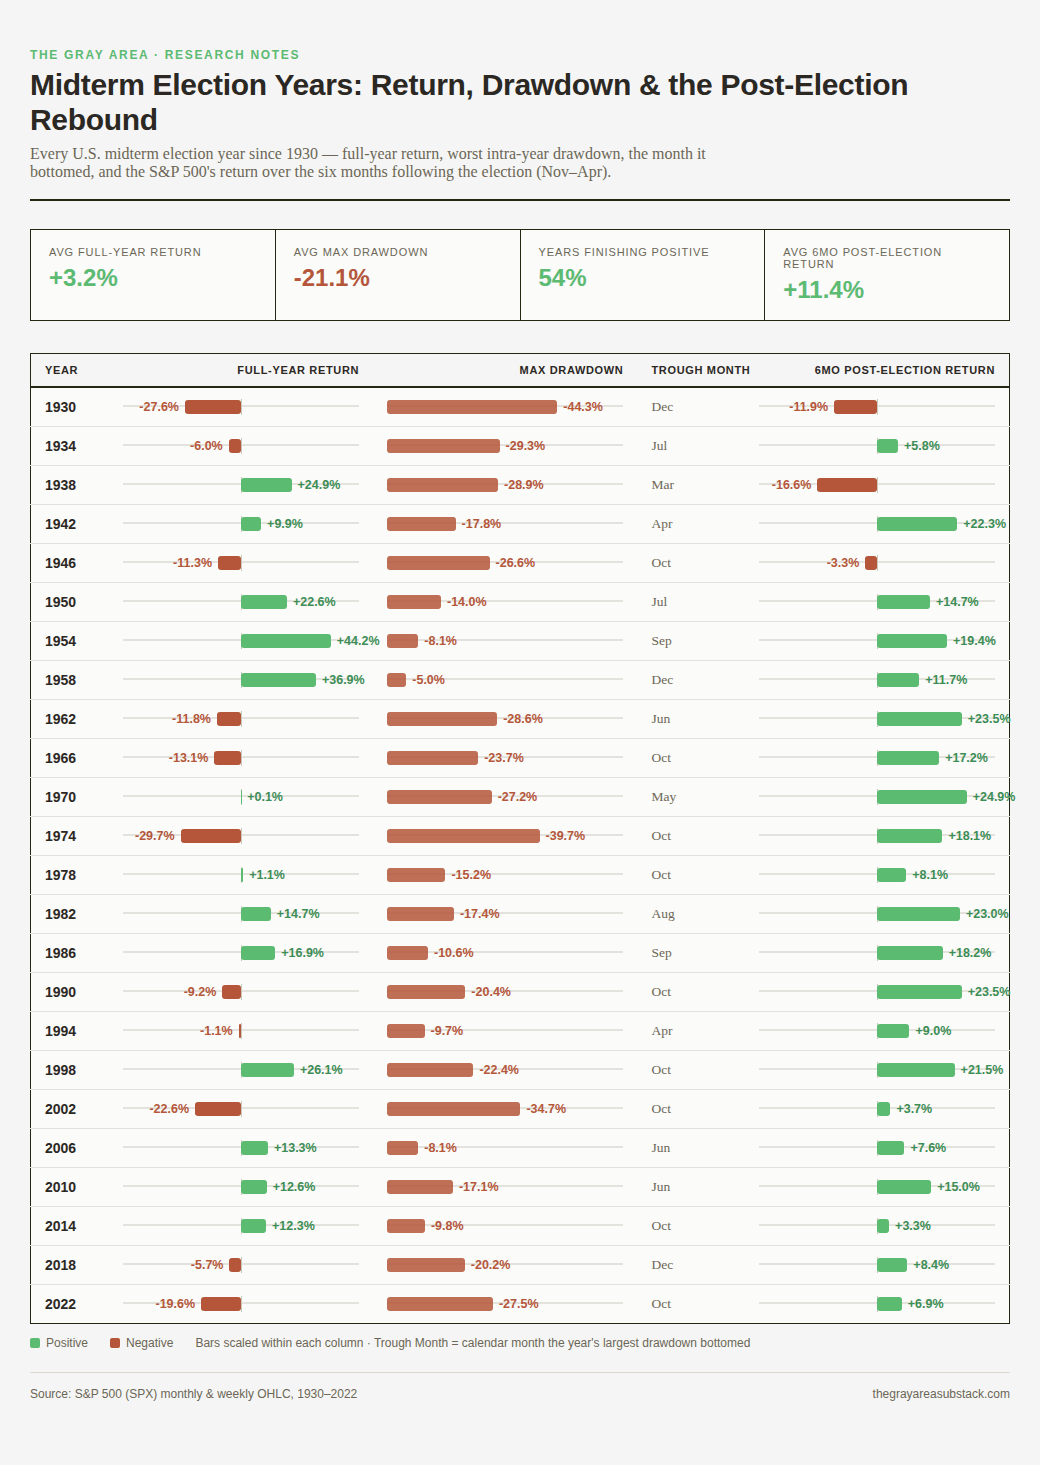
As far as when the drawdowns take place, October alone accounts for 9 of 24 (37.5%), the same as the first 7 months of the year combined. The tail end of the year (Aug–Dec window) captures 15 of 24 troughs (62.5%), while the entire first seven months of the year (Jan–Jul) account for only 9 of 24 (37.5%). Statistically, the late-year correction clustering is even more significant than the return differences between midterm and non-midterm election years. There has never been a mild correction in Q1, so 2026 would be historic without another >9.5% correction later this year.
Federal Reserve
To add a further wrinkle to the mix, we had a new Federal Reserve chairman, which can bring uncertainty to the monetary environment. Looking at the last 12 chair switches, returns tend to be slightly worse, but it is not significant. Perhaps it’s not the person, but the policy that makes the bigger difference.
Layering in which interest rate regime coincided with the midterm year may give clues to whether it will be a particularly bad year or not. From this analysis, an active Fed tends to be worse than a stagnant Fed in terms of full-year returns. Post-rate-cut plateaus showed milder max drawdowns. There isn’t much difference between any regime in the 6-month post-election returns.
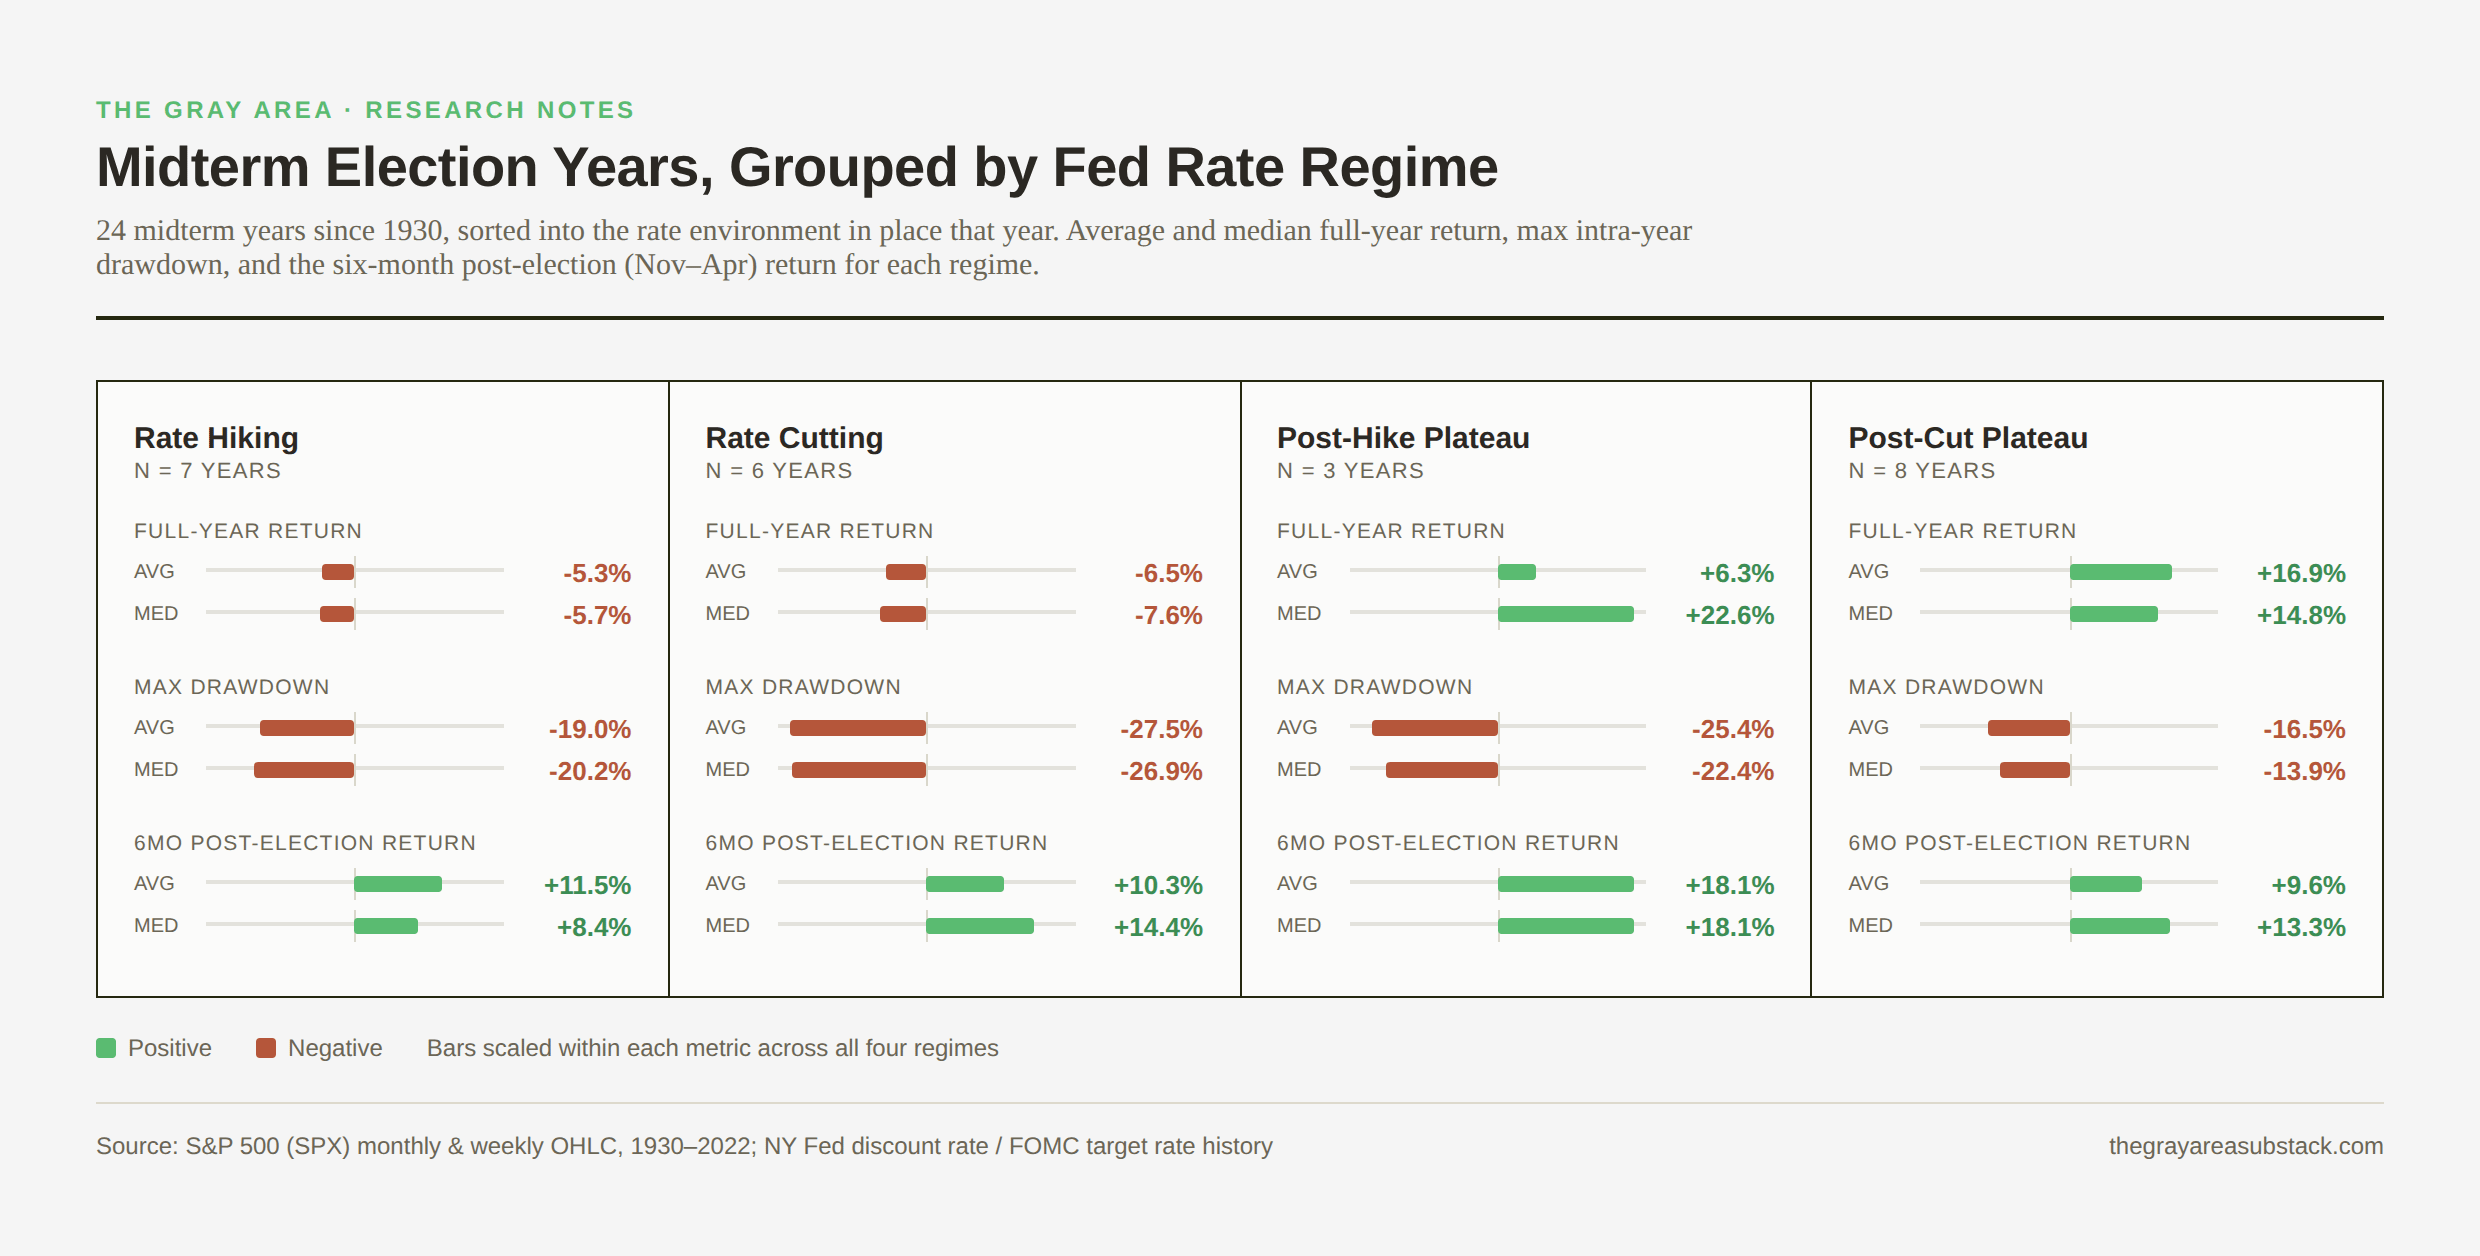
Typically, the worst scenario is a rate-cutting regime, which we are currently in by my definition. While the sample sizes are small, our current year would be a strikingly positive anomaly based on these historical conditions if things stay positive.
Other Methods
Perhaps economic conditions of the time may influence what type of midterm correction there is. Checking both whether there was a recession the prior year or how much GDP growth there was proved completely insignificant.
Perhaps the government makeup influences returns. Political party did not influence returns, but whether Congress was unified or divided did. Divided government years had a meaningfully higher positive-year rate (66.7% vs. 46.7%), a stronger average full-year return (5.1% vs. 2.2%), and nearly double the post-election bounce (+16.4% vs. +8.4%). Max drawdown had no difference, and only the post-election bounce was close to statistical significance. Gridlock may in fact be good for markets, at least for midterm years. Today we have a unified Congress, which points to slightly worse outcomes based on history.
Momentum and volatility don’t seem to matter much either. If the prior year was very positive (15+%), mildly positive (0-15%), or negative, there wasn’t a significant difference. The same happened when I ran whether the prior year had a larger or smaller drawdown. There wasn’t any predictability from the prior year.
Since most of the time corrections happen in the latter half of the midterm year, what if there is a correction in the first quarter? First, we have to separate whether there is a bull market or not, since bear markets would skew the data fast. We’ll define that as 20% off the previous low. The median Q1 correction splits the series at 9%. Non-bull market years are worse from a max drawdown and post-election return perspective, but neutral for full-year returns. Bull markets with mild or no Q1 correction have the best outcome for each category. Including >9% correction years, it becomes the category with the worst yearly return.
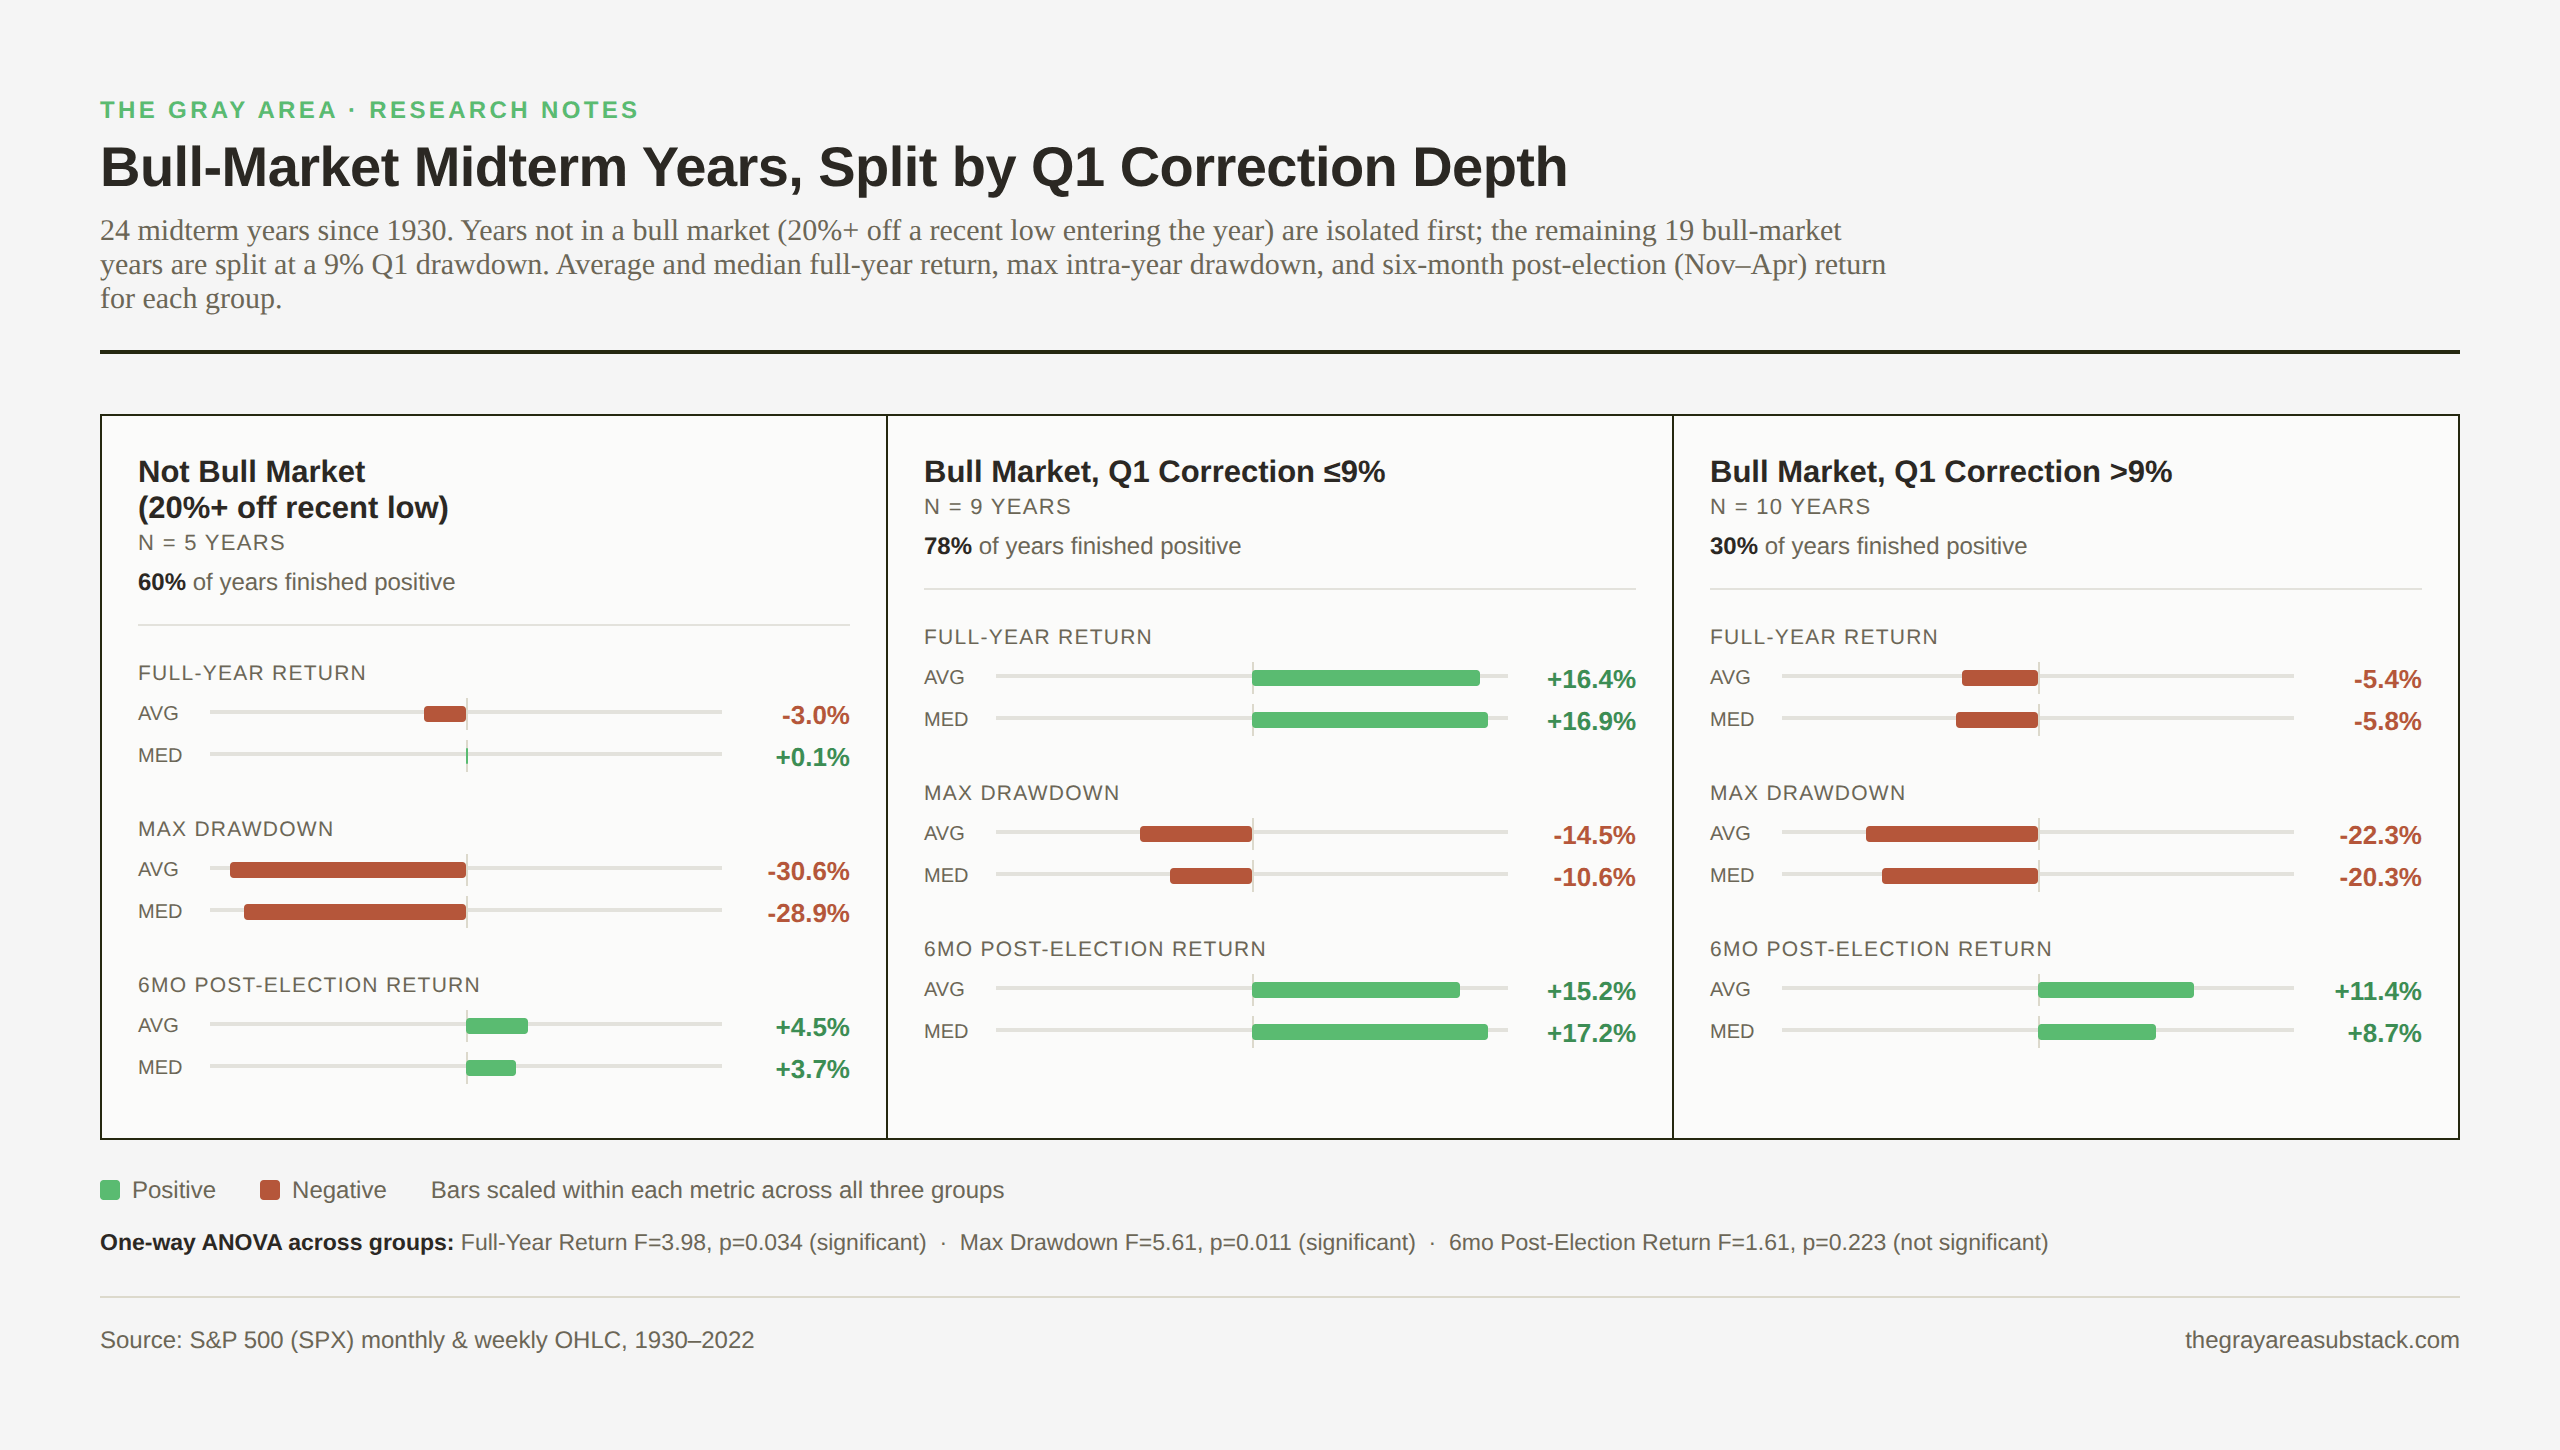
You might retort that, of course, the year is weaker if it starts with a >9% correction, but in only 2 out of 10 bull market cases was the Q1 correction the largest of the year. October had the most full-year troughs (6 of 10). Only 1982 and 1994 had the Q1 low double as the year's real low. Typically, the Q1 correction is not the largest of the year. Even when you further select for years where the market swiftly reclaimed highs like 2026, the results don’t change. It would be against historical precedent for today’s market to continue without another correction.
Quick Points:
No midterm year in 96 years has combined a shallow drawdown (<10%) and an early trough.
Historically, the real low tends to be larger and show up later in August through October, even with stronger Q1 corrections.
2026 is also a Fed-transition midterm year which has historically run cooler and had larger maximum drawdowns than we’ve observed so far.
Political party doesn’t matter, but divided Congress tends to have worse outcomes (gridlock=better).
Previous year momentum/volitility/GDP are not significant.
Valuation extremes bode worse and had larger drawdowns than average (1966, 1970, 1998, 2022). They were also stronger than average in the 6 months post-election.
Midterm years were reliably positive in the 6 months after election across the series other than the Great Depression and WWII.
Conclusion
Some of these are supportive of the market, and some of them aren’t. 2026 doesn’t have to follow history, but it doesn’t hurt to keep our eye on it. History suggests that another larger correction is likely before November to fit the traditional mold. Regardless, we are not in a historically bad environment, so the odds of a good post-election rebound are good based on this analysis.
Not once did a bear market begin in the midterm election year, but a few times it followed it. The 6 months post-midterm were strong throughout the sample (outside GD and WWII), but peaks were found in the market 3 times in the year after. 1987 flash crash, the 2007 peak, and the 2019 peak were all found in the following year.
Could this mean we get a second correction into midterms, a solid rally higher, before finding a major top in 2027? It’s too early to tell for sure, and we will find out together. To help learn how to navigate this with a portfolio, please consider upgrading to find access to The Gray Area model portfolio. We discuss real-time risk management, position sizing, technical indicators, what to keep an eye on in the markets, and an example of a better total and risk-adjusted return than just buy-and-hold S&P 500.
-Grayson
Socials
Twitter/X - @graysonhoteling
Email - thegrayarea55@gmail.com
Archive - The Gray Area
Notes - The Gray Area
Promotions
Sign up for TradingView
For educational and entertainment purposes only. The Gray Area should not be taken as financial advice.
Good article. It’s a bit annoying that you beat me to it, since I’m currently working on an article about how markets move around elections hahaha.
They've started up yield curve control, don't know how that fits into things but the debt is looming.