
No Bailout For You
In 2000 and 2008, institutions got rescued and individuals suffered. Now, equity exposure and retirement fragility are higher than ever before.

If you find this article interesting, click the like button for me! I would greatly appreciate it :)

What is retirement? Right now, we work and save up enough money in our 401k so we can have enough money in those final years where we don’t have jobs anymore. Older readers may know a different way, where they work for a company for 30 years and collect a pension for the rest of their life. That sounds pretty nice, so what happened?
The whole history is in the figure below, but in the late 1970s, a law was introduced to help structure defined benefit (DB) programs (think pensions). This and other tax laws over time made DBs more burdensome and defined contribution (DC) plans (think 401k) more attractive. Eventually, this evolved into very specific target date funds being the default allocations for 401ks leading to the distorted passive investing conundrum that I’ve discussed previously [1, 2]. Over time, DCs have dramatically replaced DBs.
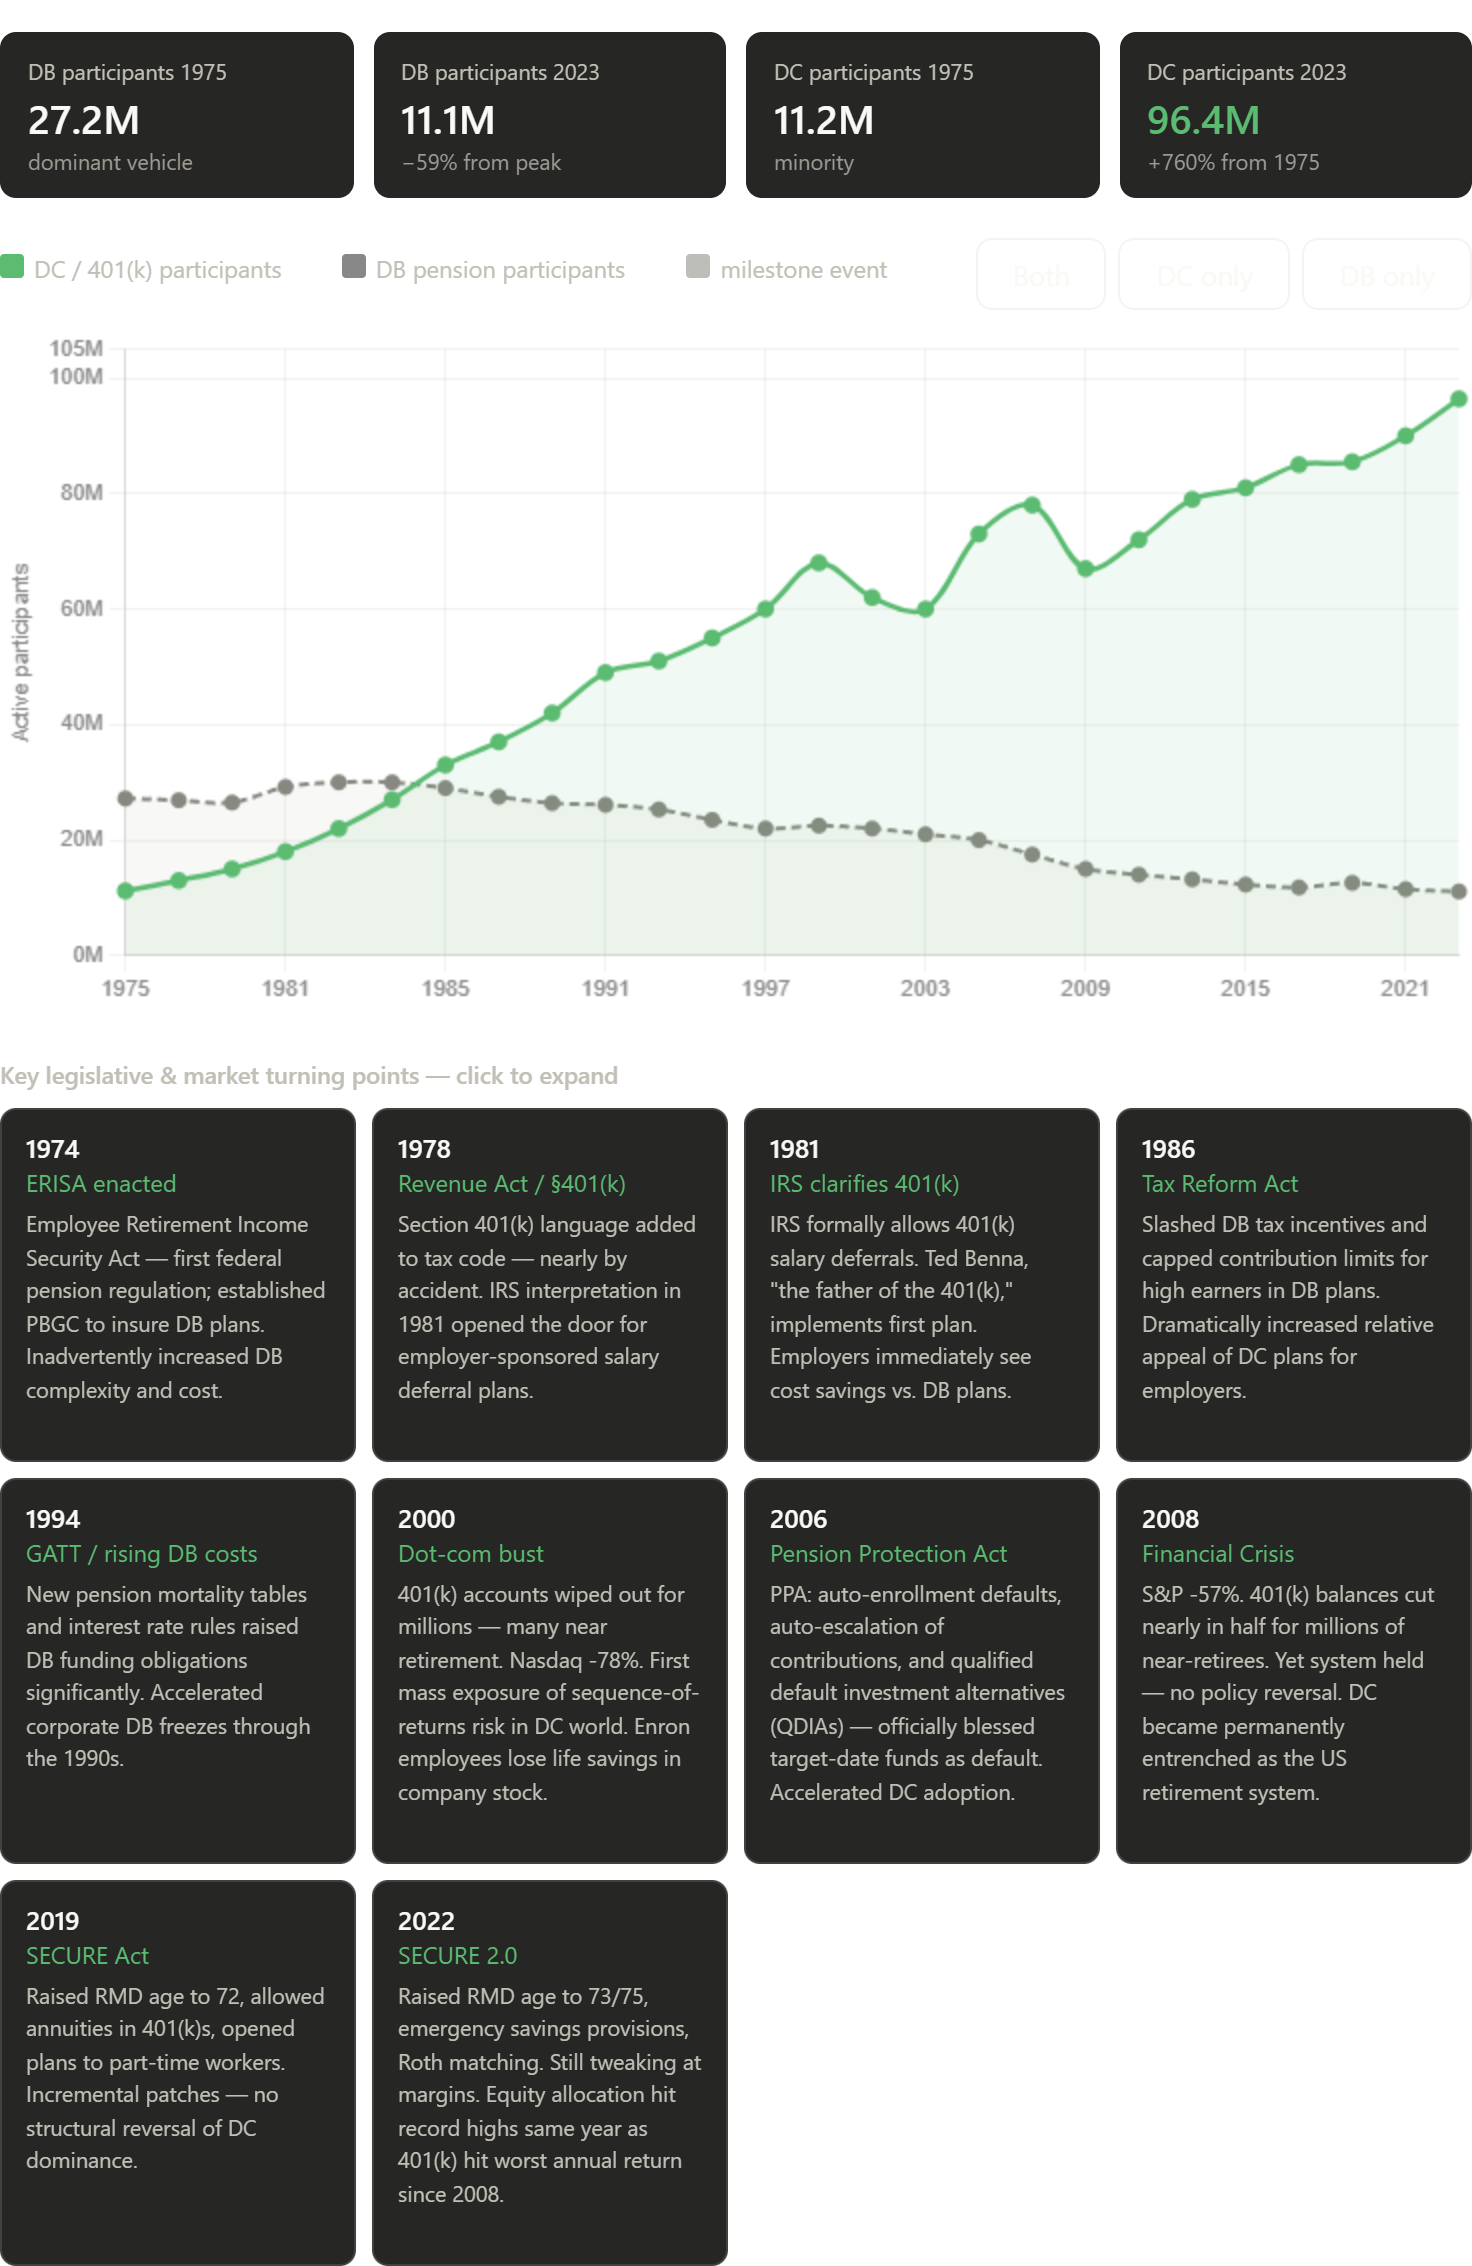
So what’s the issue? This is more capital efficient and gives employees more flexibility. This worked perfectly from 1980 to 2000 in a raging bull market. In 2000 and 2008, equities took ~50% haircuts. For your retirement to be tied to this is devastating. Many had to delay retirement, rely on housing equity or social security, or suffer a less lavish retirement.
In those years, equities only made up 15-20% of household net worth. Today, it is over 25% and rising. On top of that, the switch to target date funds essentially just owning the S&P 500 accelerated after the financial crisis in 2008. Not only do equity bear markets hurt retirement, equities ARE retirement today.

People have once again become complacent with ballooning assets, whether they be stocks or real estate. With record wealth tied to the stock market and retirements entirely tied to the stock market, the risk is larger than it has ever been. Not to sound hyperbolic, but soon to be retirees could have their lifestyles destroyed if they time things wrong.
The Shiller Price to Earnings ratio (also CAPE ratio) is a stock market valuation metric. It essentially shows the price investors are willing to pay for the given earnings a company generates and has to do with confidence and sentiment. The Shiller P/E ratio is the second highest in history behind the dot-com bubble in 2000. However, if we draw a trend channel, it implies 1901, 1929, and 2000 were more expensive historically. The bottom trendline dates are 1920 and 1982.
What this figure shows us is that while stocks are expensive today, they technically could have more upside. There is typically 30 years between tops and bottoms of this series and it doesn’t have to hit the top or bottom trendlines to mark a major reversal point. 1877, 1949, 1966, and 2009 marked minor reversal points, while 1901, 1920, 1929, 1982, and 2000 marked major reversal points.
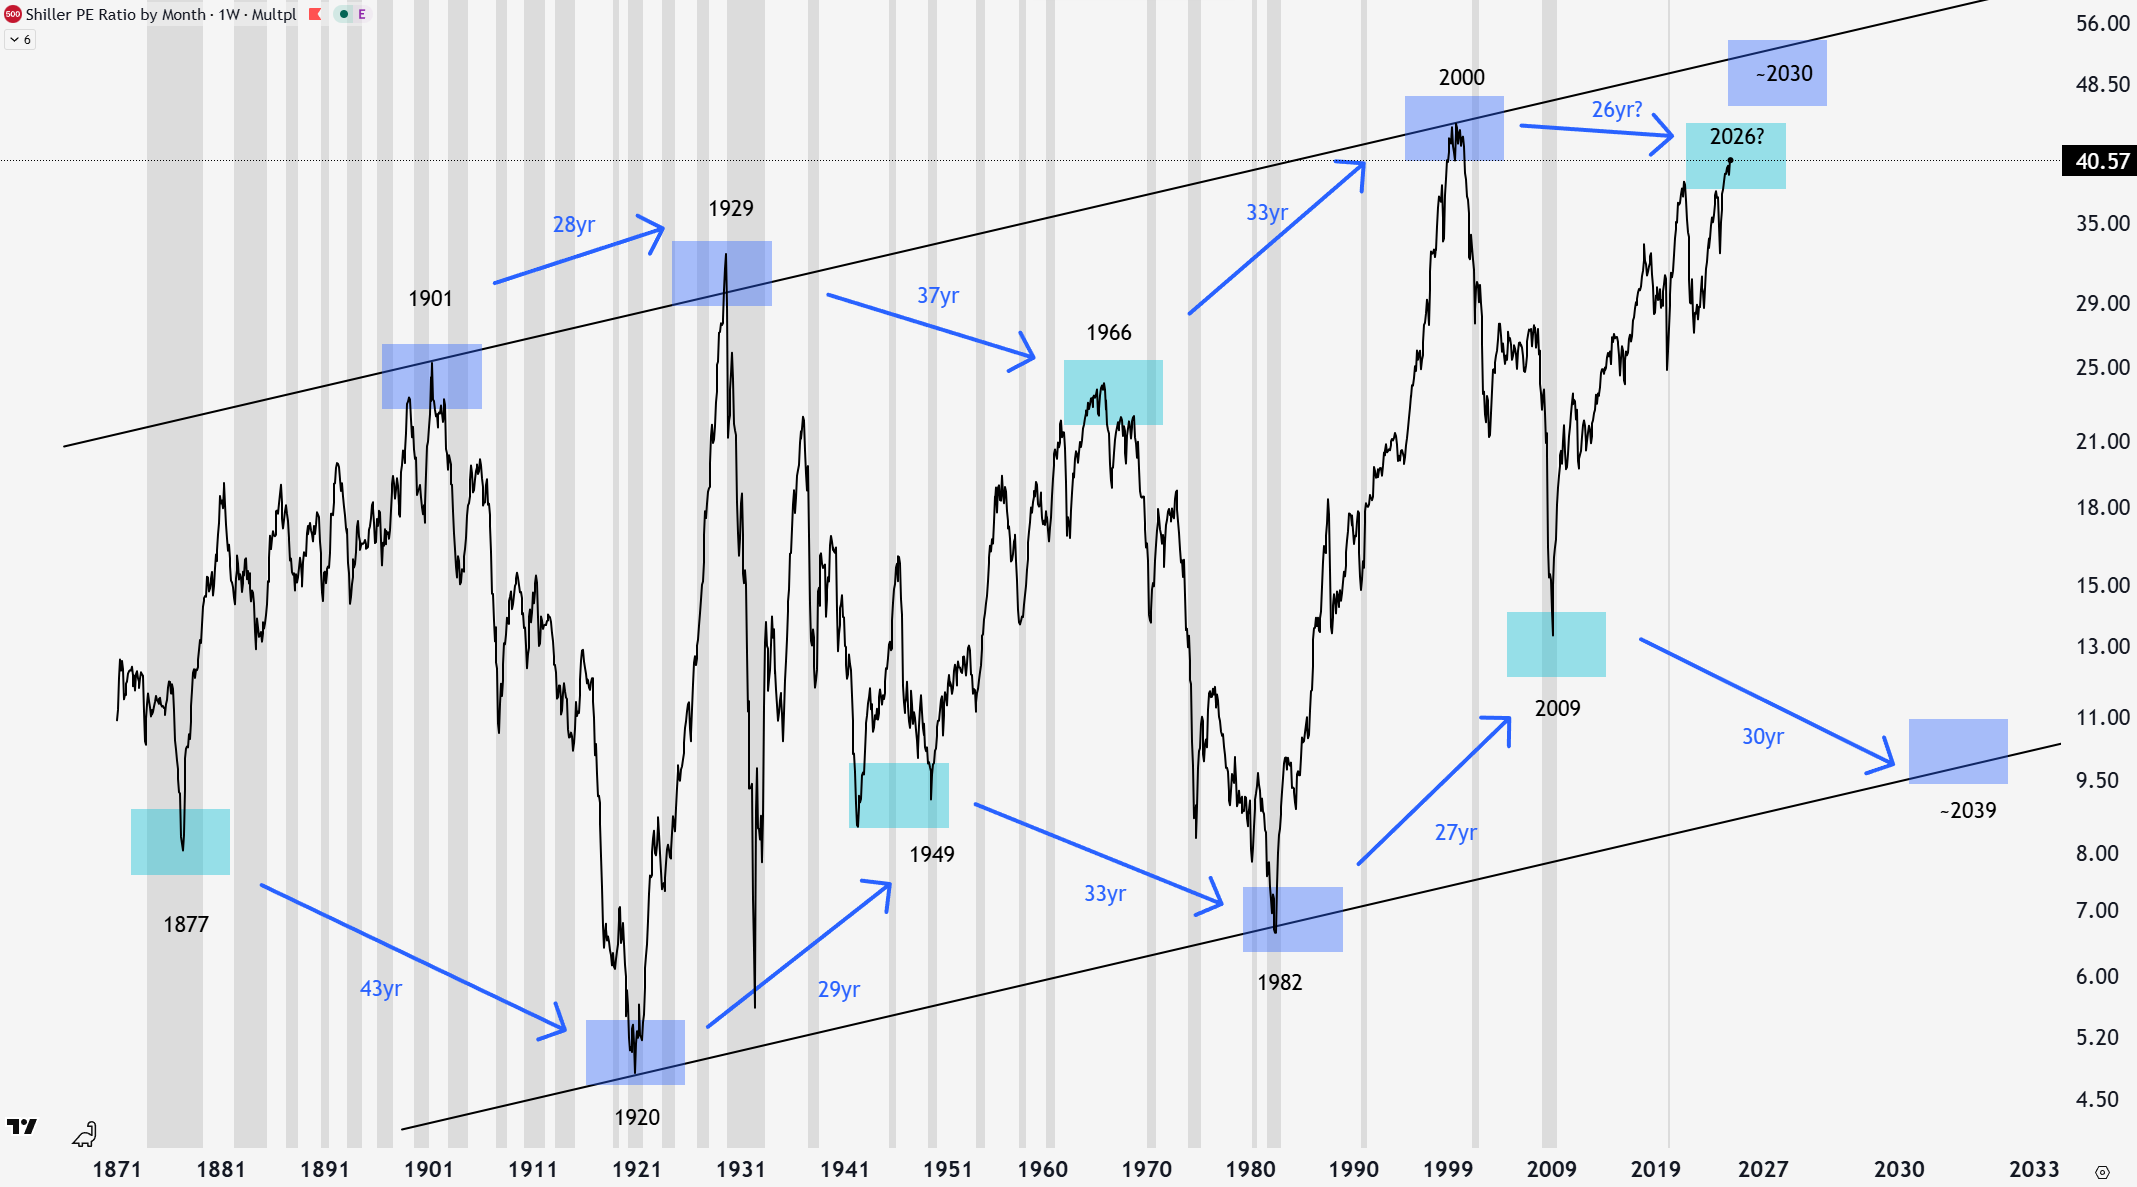
It has been 26 years since the 2000 peak, within the territory for a minor reversal. With the leading recessionary indicators I’ve discussed previously, this is a possible and likely scenario. I could be wrong, and valuations could soar in a stock blow off top for a few more years into the darker blue box at ~56 in ~2030.
In 1966, most retirement was in DBs, meaning people were insulated from the equity corrections in the 1970s. While inflation still proved burdensome over that decade for those collecting their pension checks, their retirement wasn’t tied to assets.
In 2000, DCs or 401ks were the majority retirement savings vehicle, causing a much larger stir. Some who held retirement equity in their companies who went bankrupt were wiped out, others who held stocks took a significant haircut. While it took years for stock prices to recover, it wasn’t a catastrophe. No bailouts of individuals occurred this time or in 2008, that is reserved for institutions. In 2006, they came up with a wonderful policy, the Pension Protection Act. This made auto-enrollment in target date funds the default, which only makes people more dependent and reliant on equities. In my opinion, this leaves retirees less protected, not more.
In 2000 and 2008, aggressive easy monetary policy re-inflated assets and eventually restored equity prices and retirement balances. This took years though, and anyone switching to withdrawals or nearing retirement had a lot of thinking to do. Even though corporations were bailed out, individuals were left to dry with their impaired portfolios.
History shows that equity repricing at P/E extremes is always painful. At prior peaks, most people had pensions, savings accounts, or social safety nets that existed outside of equities. Today, the retirement system is the equity market. While social security and housing equity may insulate to some extent, individual retirements are tied to the stock market like never before, with another looming extreme P/E reversal.
Here at The Gray Area we are focused on true diversification, to help you not have your hard earned retirement get destroyed, not take unnecessary losses along your wealth building journey, and find asymmetric investing opportunities. If this sounds good to you, join premium subscription to get access to the model portfolio which synthesizes these themes into my investing plan.
Until next week,
-Grayson
Like to see these asymmetric opportunities synthesized into a real model portfolio that beats the S&P 500 and avoids major downside risks?
Socials
Twitter/X - @graysonhoteling
Email - thegrayarea55@gmail.com
Archive - The Gray Area
Notes - The Gray Area
Promotions
Sign up for TradingView
For educational and entertainment purposes only. The Gray Area should not be taken as financial advice.