
Precipice
The economy is not in recession, but leading indicators warrant caution.

If you find this article interesting, click the like button for me! I would greatly appreciate it :)

In 2022, many people thought we were heading into recession, only for GDP to normalize, unemployment to remain stable, and the stock market to recover and push to significant new highs. They were wrong, and here we are a whole 4 years later with everything still jolly and happy.
For the past few years, AI hype has broadly boosted an otherwise mediocre economy. Data center spending boosts some of the cyclical aspects of the economy like construction and manufacturing, while hype boosted asset prices in the space. This disproportionately helped the top stocks, which also see the most passive inflows and dominate the S&P 500 index.
Of course not everything is jolly, as conflict in the Middle East, involving the US, is certainly spooking investors as of late. Oil price spikes, as I predicted before the war, often times lead to serious demand destruction. Now, the predictions for recession are starting to increase again. Will they be wrong again or is there more to the story?
Sure, oil drives the economy, and this is definitely a volatile addition to the economy, but it doesn’t 100% mean there will be a recession (especially if there is a quick resolution). There are plenty of indicators we can look at to check on economic health, oil shocks just accelerate us towards that end point, not necessarily cause it.
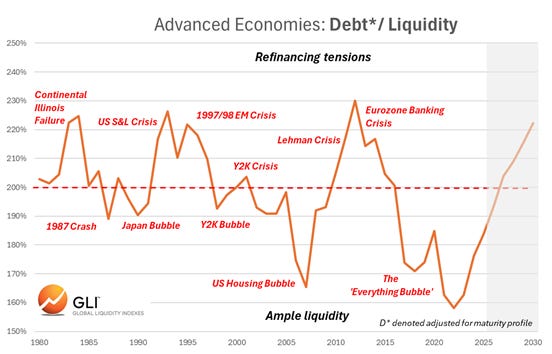
Liquidity is a major driver of the business cycle, especially in our credit/refinancing driven world today. Oil lowers liquidity by lowering margins, forcing liquidations of assets, and causing companies to increase hedges. On top of that, Michael Howell’s liquidity index has peaked at the end of 2025. With growing debt burdens being refinanced each year, the debt to liquidity ratio is steeply rising. With tightening liquidity and increasing debt refinancing demands, the risk for credit events is quickly rising.
The Conference Board leading economic indicators have been flashing recession signals since 2022, leaving many people dismissive of them. In reality, there are better ways to measure leading indicators than there measure.
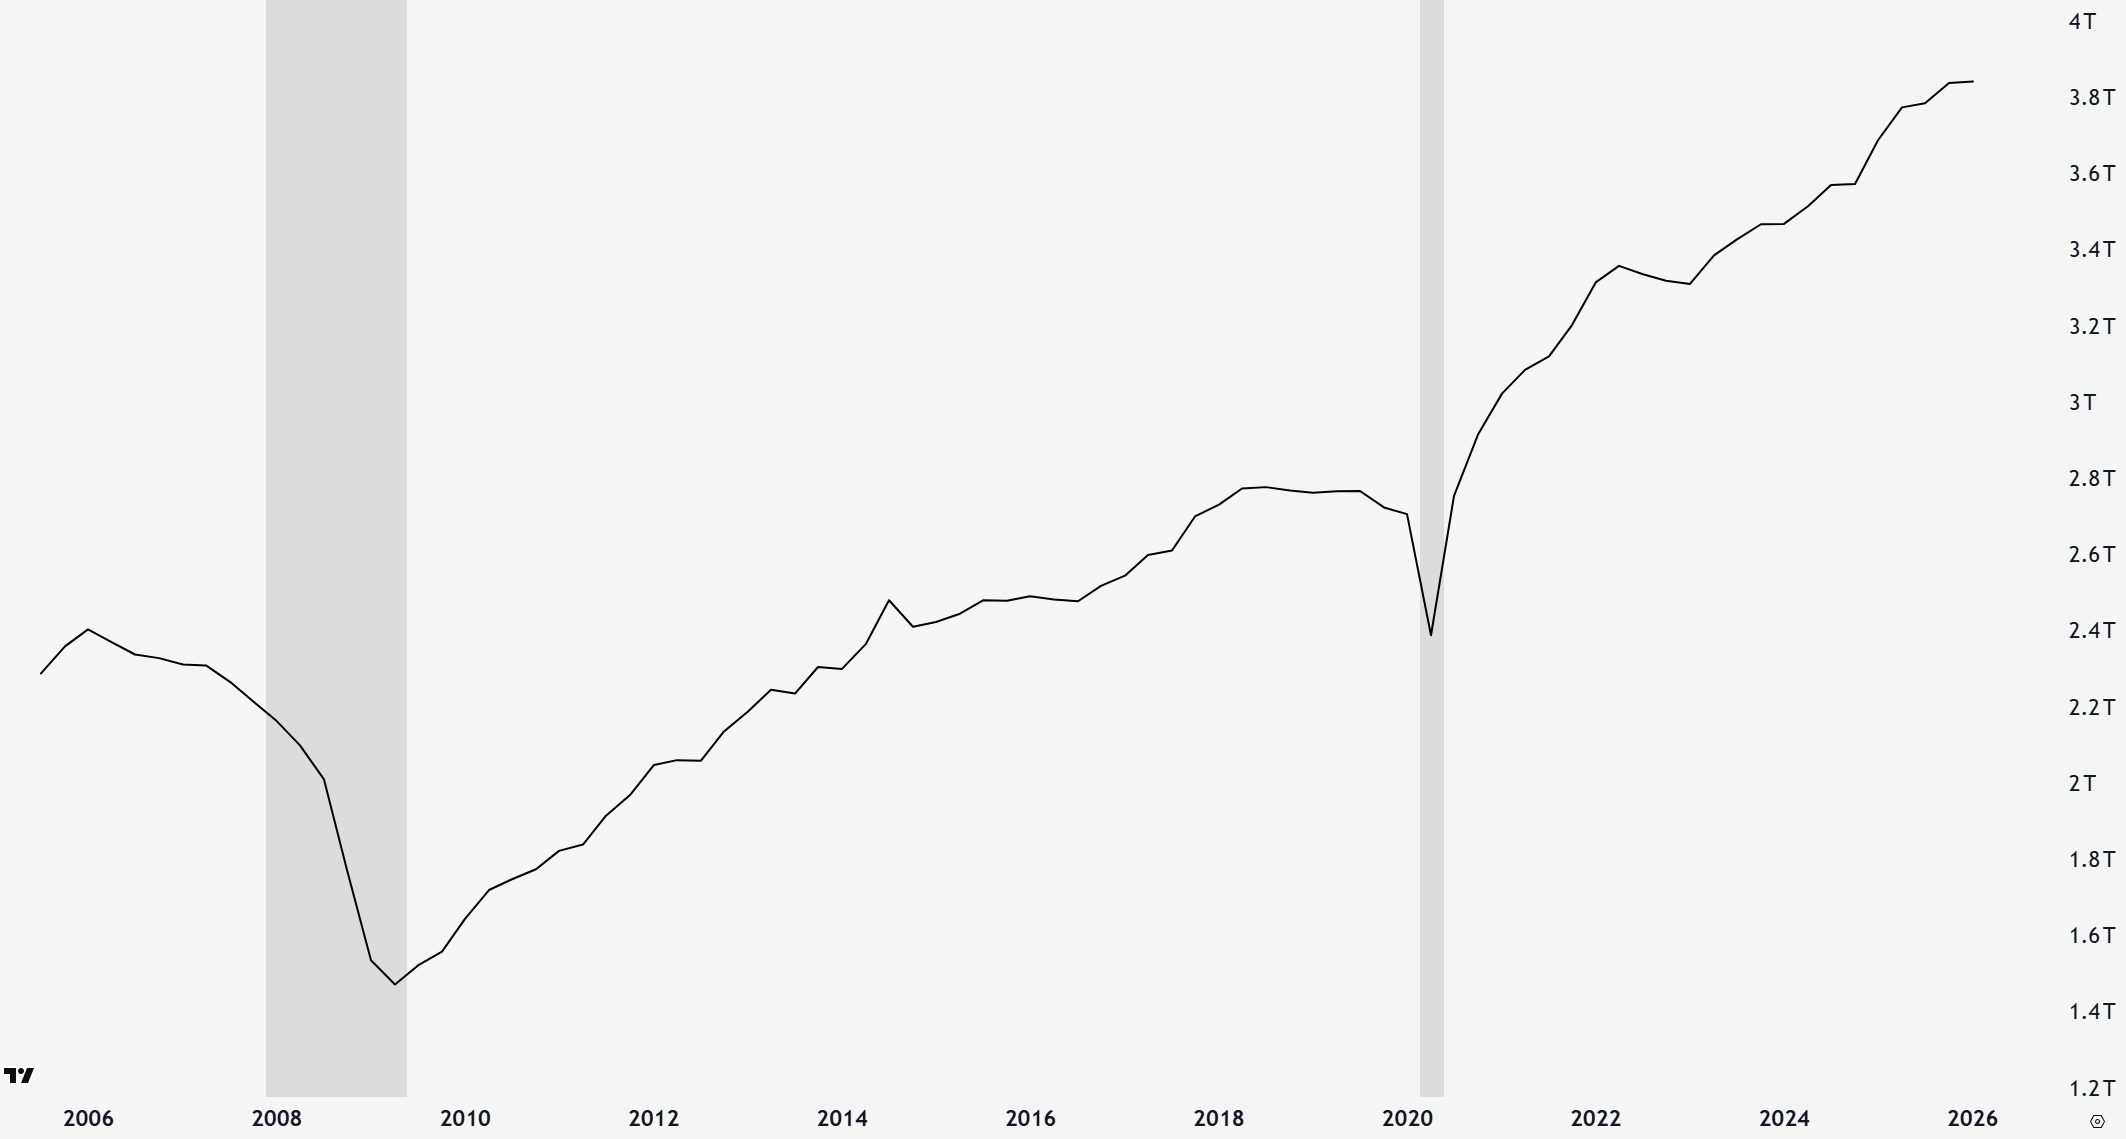
The economy (GDP) is driven primarily (70%) by consumer spending. Since many parts of the economy are not cyclical (ie. healthcare spending), we should focus solely on the cyclical aspects. EPB Research suggests that durable goods orders, residential investment, and business equipment investment are the three best cyclical leading indicators.
Plotting these, we can see it’s historical usefulness, with rollovers predicting the 2008, and 2020 recessions in advance. The series was weak for 9mo before 2008 and 20mo before 2020. The most recent 3 months have shown a stagnation, but not outright decline (equipment investment propped up by data center investments).
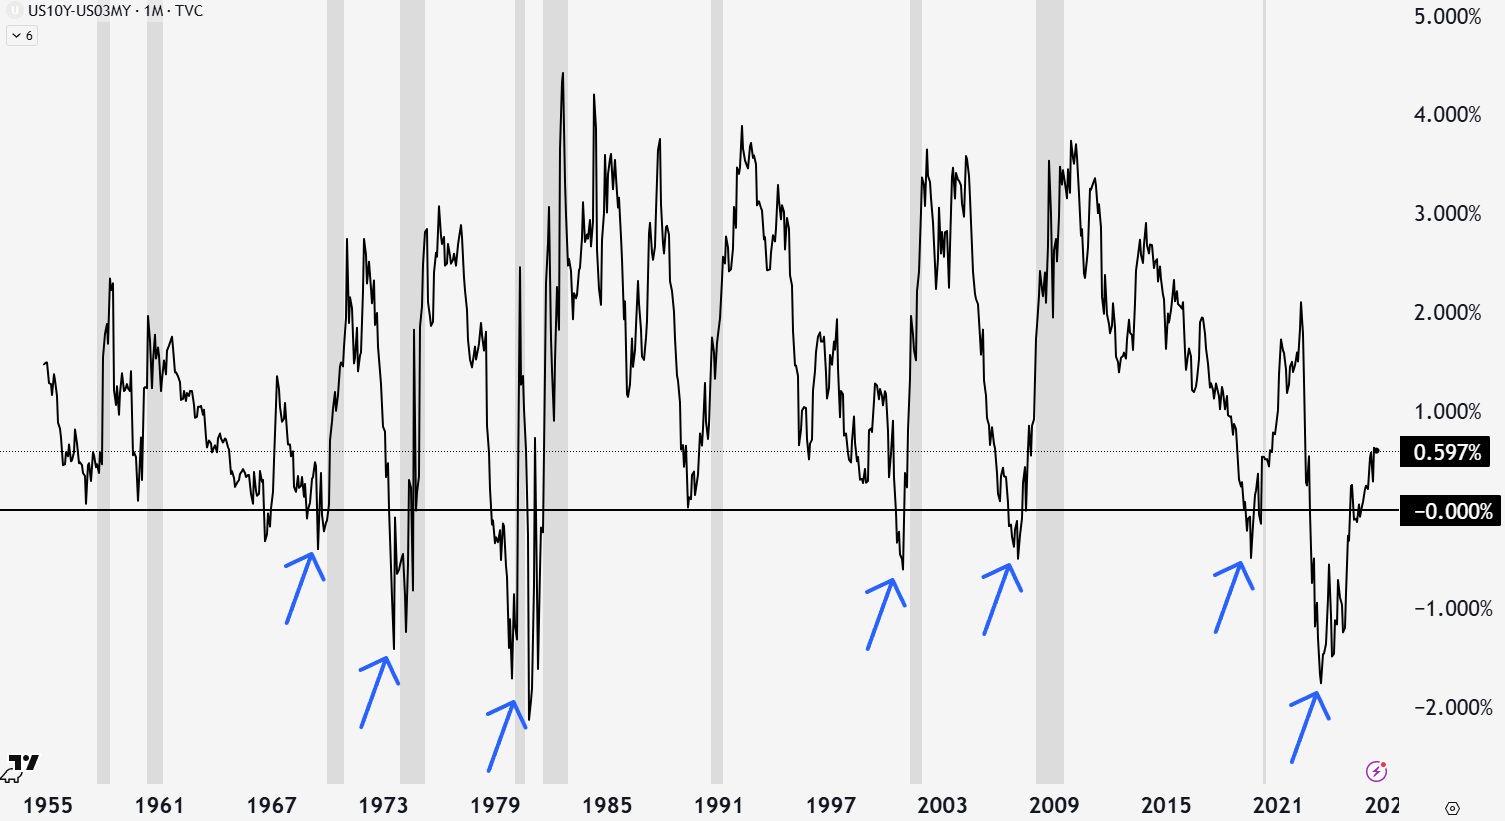
The yield curve is the difference in interest rate between two duration bonds (long vs short). Typically the 10 year note has a higher interest rate than a 3 month bill. Economic growth and inflation are taken into account over the longer time frame. Basically, investors have to decide where to place money (stocks, bonds, cash, etc) and depending on the economic environment, it changes. Bond yields adjust over time based on the sentiment/demand for the bonds (higher yield, less demand). Supply also matters, as excessive issuance of short term bonds like we’ve seen can push yields higher.
For brief times in history, short term yields are higher (yield curve inversion or <0), sending strange signals. The un-inversion concludes with short term interest rates dropping faster than the longer term bonds. This means that investors are demanding bills and bonds as safe assets or liquidity, typically during credit crisis and recession.
The un-inversion of the yield curve has always preceded recession going back to the Great Depression. We just un-inverted from the most extreme inversion in history, bigger than the Great Depression and 2008 Financial Crisis. This is another sign that recession is looming. Plus, with some correlation between inversion magnitude and economic impact, it could be a big one.
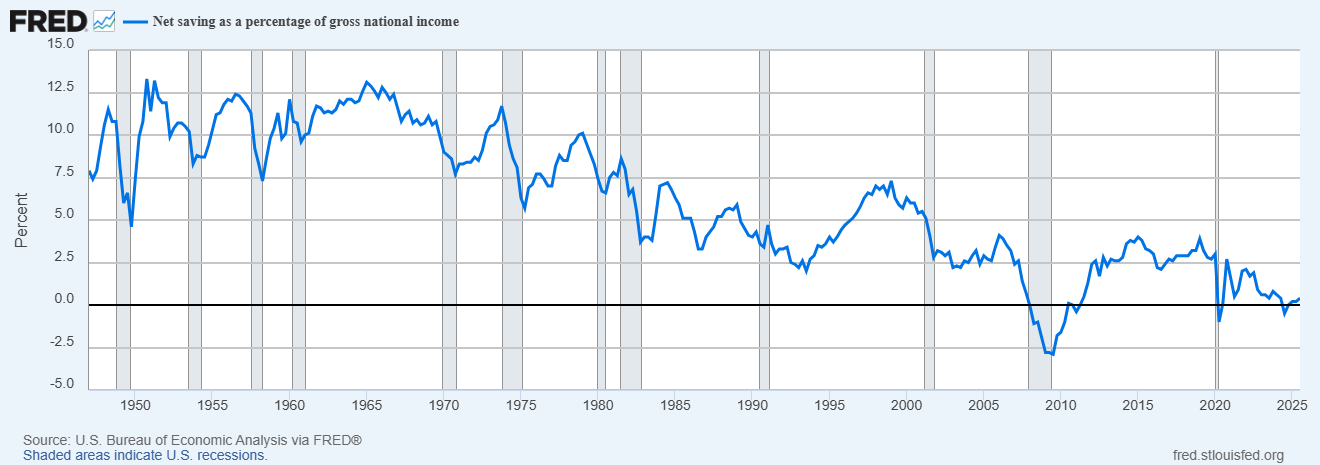
Even though we are a credit driven economy, savings spur real productivity and provide resilience. Net savings as a percent of gross national income is at scary levels only seen during the Great Depression, 2008 Financial Crisis, and briefly in 2020. This implies the economy has less cushion and would be less resilient to any credit shocks. Further, it implies that the government will have to respond with ever more debt creation during the next crisis.
What is holding everything together is employment. Recession doesn’t start until the unemployment rate is picking up significantly, although this is last domino to fall, and doesn’t help you predict when it will occur. We can look under the hood for clues.
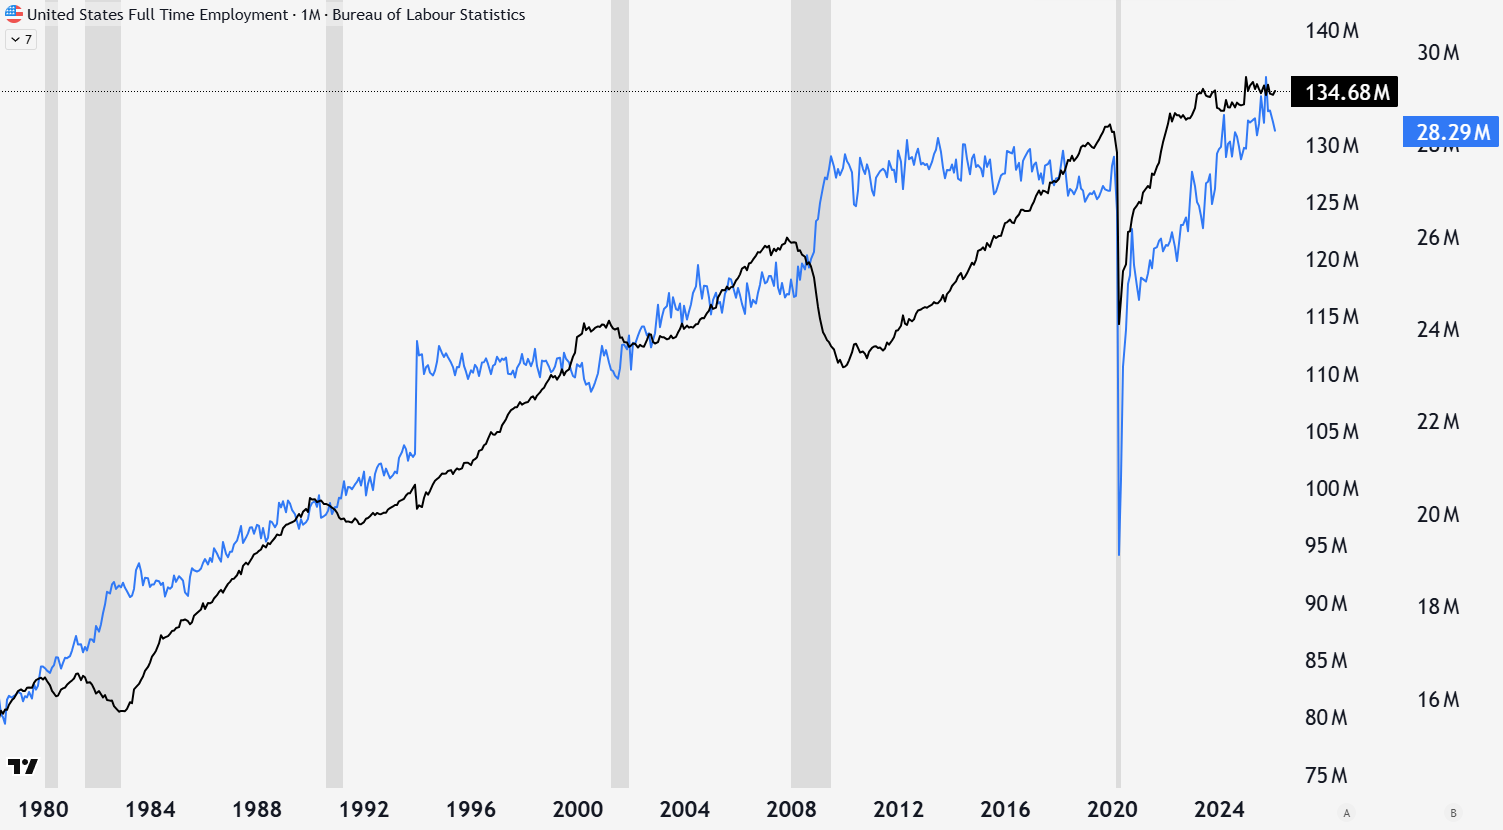
Full time employment is the real driver of income and productivity. Mediocre or declining full time employment characterizes recessionary periods. Currently, full time employment has been not been growing for years, while part time employment has, making the aggregate unemployment rate look steady.
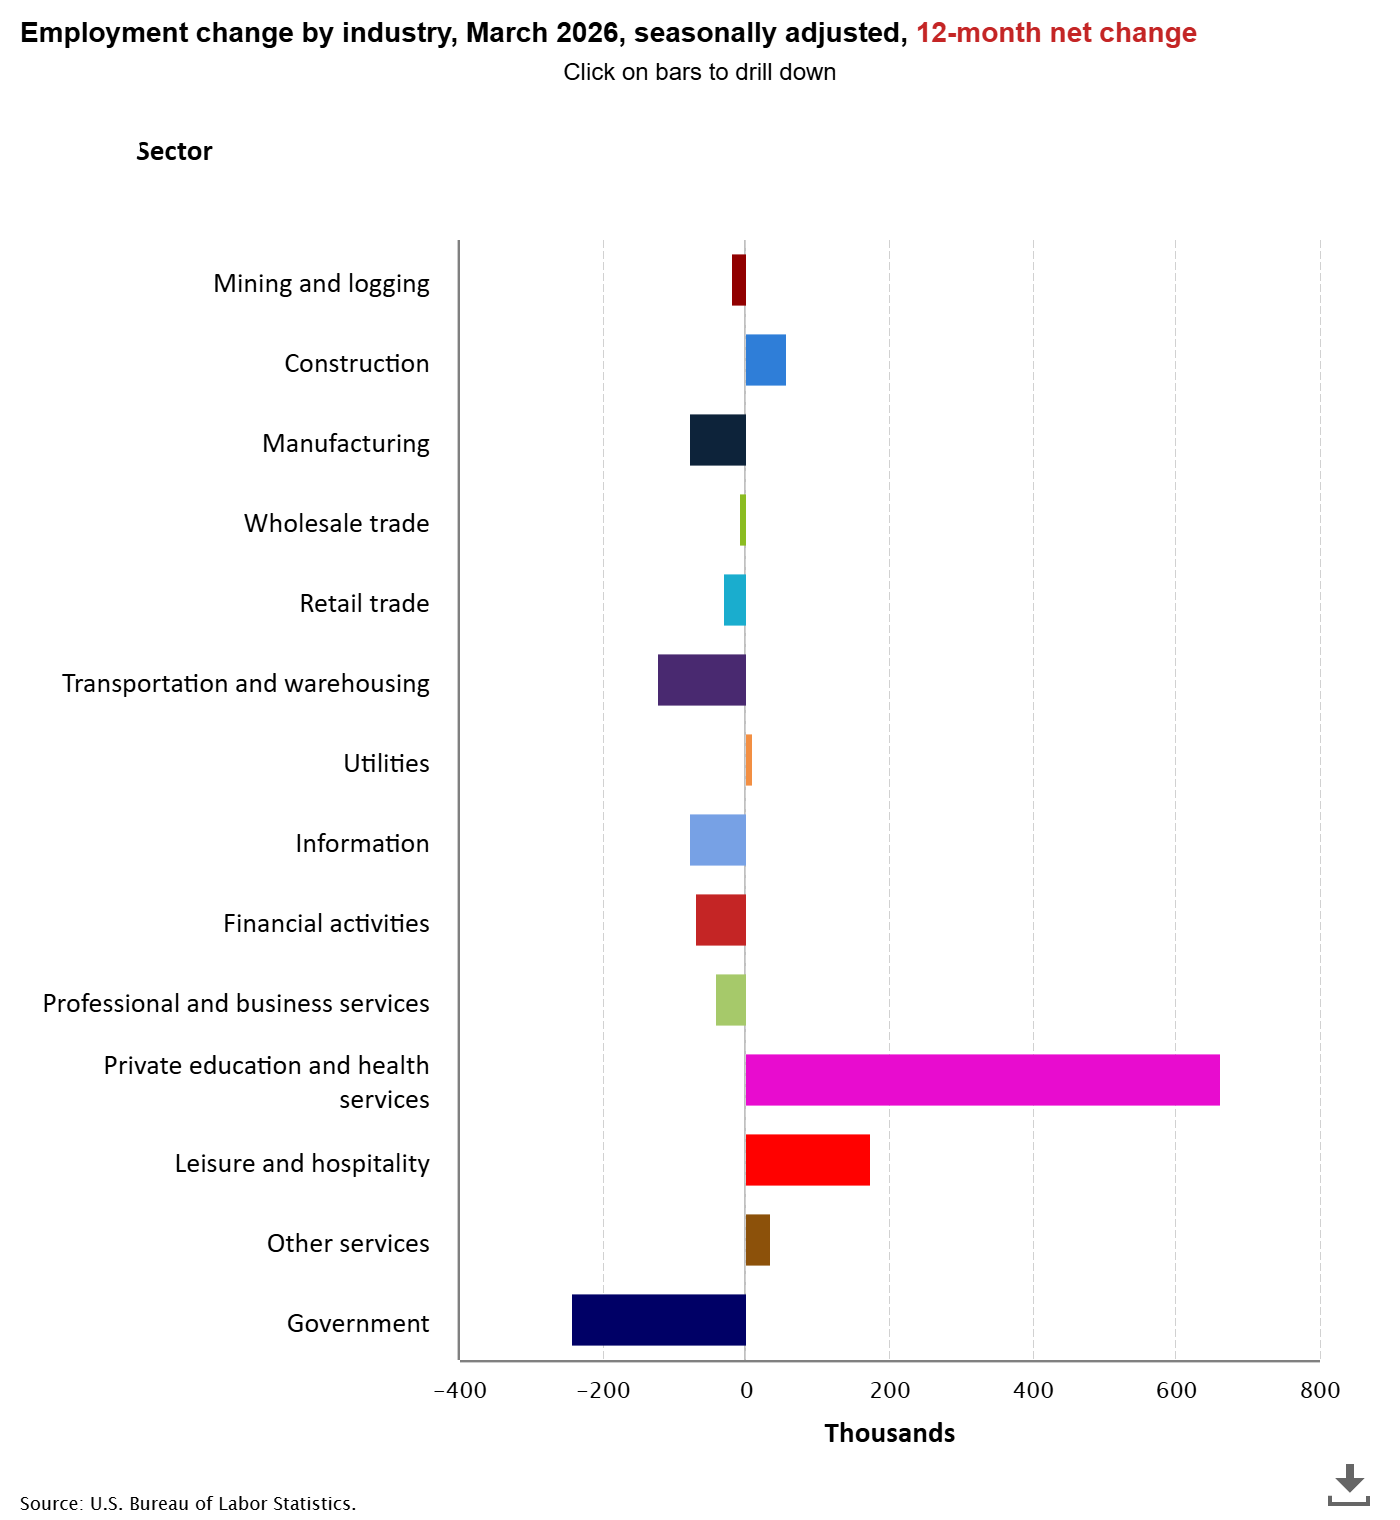
Broken down by sector, there is very little job growth for the majority of industries. Leading cyclical areas like manufacturing and transportation are showing the most weakness, while job growth was primarily driven by the non cyclical healthcare industry.
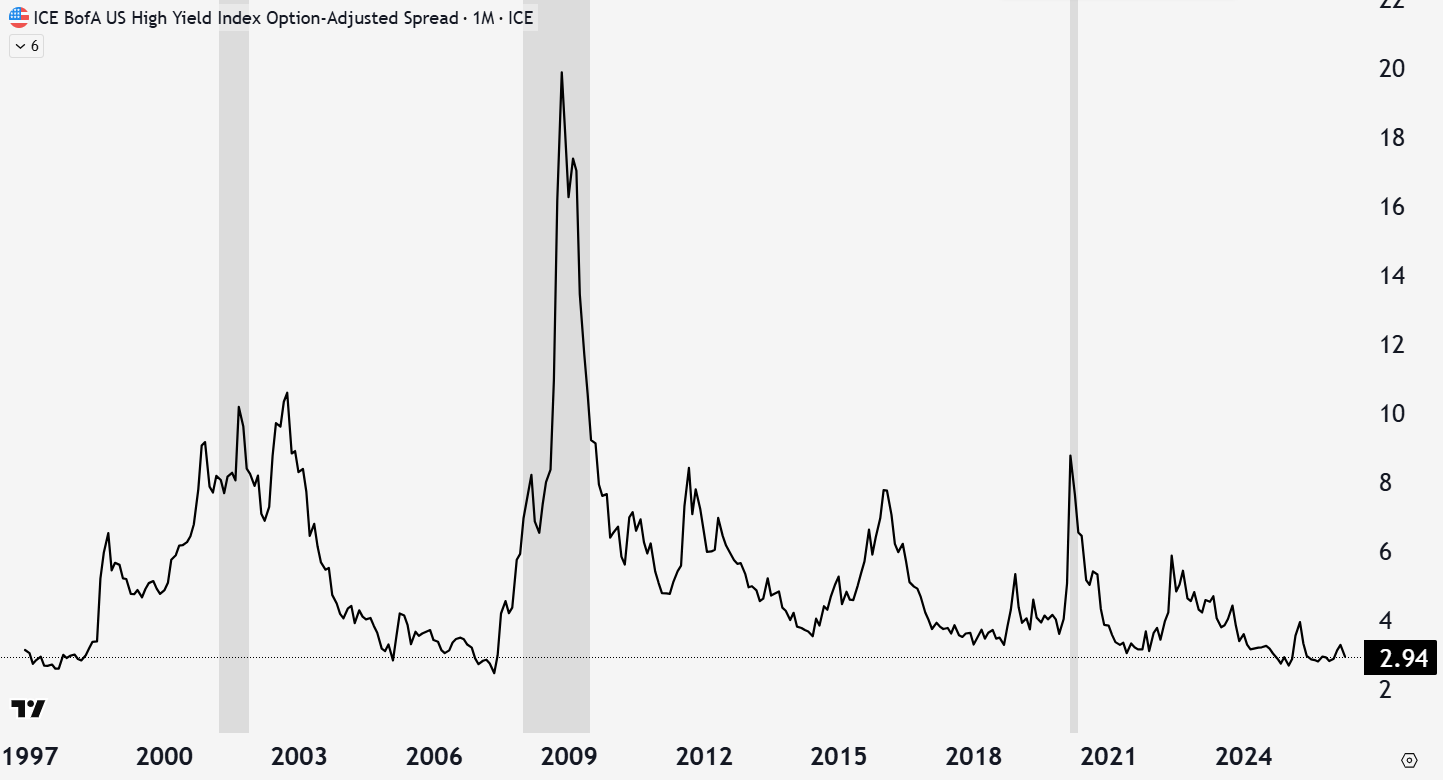
Finally, credit spreads are perhaps the best clue to tell whether things are really going to hit the fan or not. I’ve written about them extensively previously. In short, junk bonds from questionable companies demand a higher yield to garner interest from investors over safe US treasury bonds. When things are fine, the spread is low, but when anxiety, distrust, and financial issues arise, the spread widens significantly.
Credit spreads between junk bonds and US Treasuries remain at all time low levels, despite the small increase in March (zooming out you can barely notice). The market is not questioning these companies credit-worthiness at the moment. While typically leading, when credit spreads widen, it can happen fast.
The economy is on the precipice of recession, but is not there yet. Headline employment, credit spreads, and liquidity are all fine. However, they are all trending towards recession.
Liquidity conditions have rolled over, heading into record debt re-financing requirements. True leading indicators are finally showing weakness (even more stripping out data center buildout). The yield curve is currently un-inverting from the longest inversion in history, typically resulting in imminent recession. National savings are at record low levels (Great Depression, 2008 GFC). Full time employment has been stagnant, and healthcare is the only sector with meaningful employment growth. Credit spreads are holding up, but can really only go higher from here.
Everything is fine until it isn’t. It is surprising how well the economy and stock market have held up over the last few years but that doesn’t mean we won’t hit a recession. These leading indicators are flashing warnings, which not taken serious can be very detrimental to portfolios.
Economic and stock market trouble correlate, and here at The Gray Area, we are aware and prepared for these contrarian scenarios. The model portfolio is a great way to not get destroyed by a looming bear market, and way to profit from volatility to come. Until next week,
-Grayson
Like to see these asymmetric opportunities synthesized into a real model portfolio that beats the S&P 500 and avoids major downside risks?
Last week to secure the 30% discount on the model portfolio!
Socials
Twitter/X - @graysonhoteling
Email - thegrayarea55@gmail.com
Archive - The Gray Area
Notes - The Gray Area
Promotions
Sign up for TradingView
For educational and entertainment purposes only. The Gray Area should not be taken as financial advice.
So if we go into recession and stocks begin to crash, is it better to move the money into short or long term bonds?