
Model Portfolio: March 2026
Site update and a new entrant to the portfolio!

If you find this article interesting, click the like button for me! I would greatly appreciate it :)
The model portfolio was made public in July 2025. It has 5 main components: stocks, bonds, cash, precious metals, bitcoin, and a flex option. Last month’s construction and performance.
Both the portfolio (-4.31%) and market (-5.07%) lagged in March. Year-to-date, the portfolio (+3.01%) is outperforming the SPX benchmark (-5.44%). Overall, we are up 30.11% vs 11.05% for the market since inception.
Over the last month, natural gas companies have rocked, bitcoin showed some courage, and it was not a fun time to be yellow rocks.
Before we dig into the weeds and discuss changes, I’m proud to announce a new change to the website.
The three regular articles each month will remain free public posts, but the model portfolio, synthesizing that research and opportunity into a simple and easy portfolio guide, will now be exclusively for paid members.
My pitch is simple
I’m not trying to rake you over the coals to get your money, but I am already providing value and believe I will provide more as things progress.
I’m beating the market while minimizing drawdowns, finding asymmetric opportunities, and making sure to not get destroyed in a market downturns.
My three free articles are the research, but the model portfolio synthesizes that unconventional research into what I actually do with it.
The cost will be $10/mo or $100/yr. I will also be raising the price again to start 2027 as my track record continues.
However, for the channel OG’s that sign up in the next month, will get it for $7/mo or $70/yr (which comes out to $5.70/mo) which will stay that price forever, and absolute steal.
To keep getting beating the market, identifying actual diversified and good investing opportunities, and to see how this months allocation changed, please consider joining me with a premium subscription.
Now back to the data for a preview of the analysis and what you’re getting!
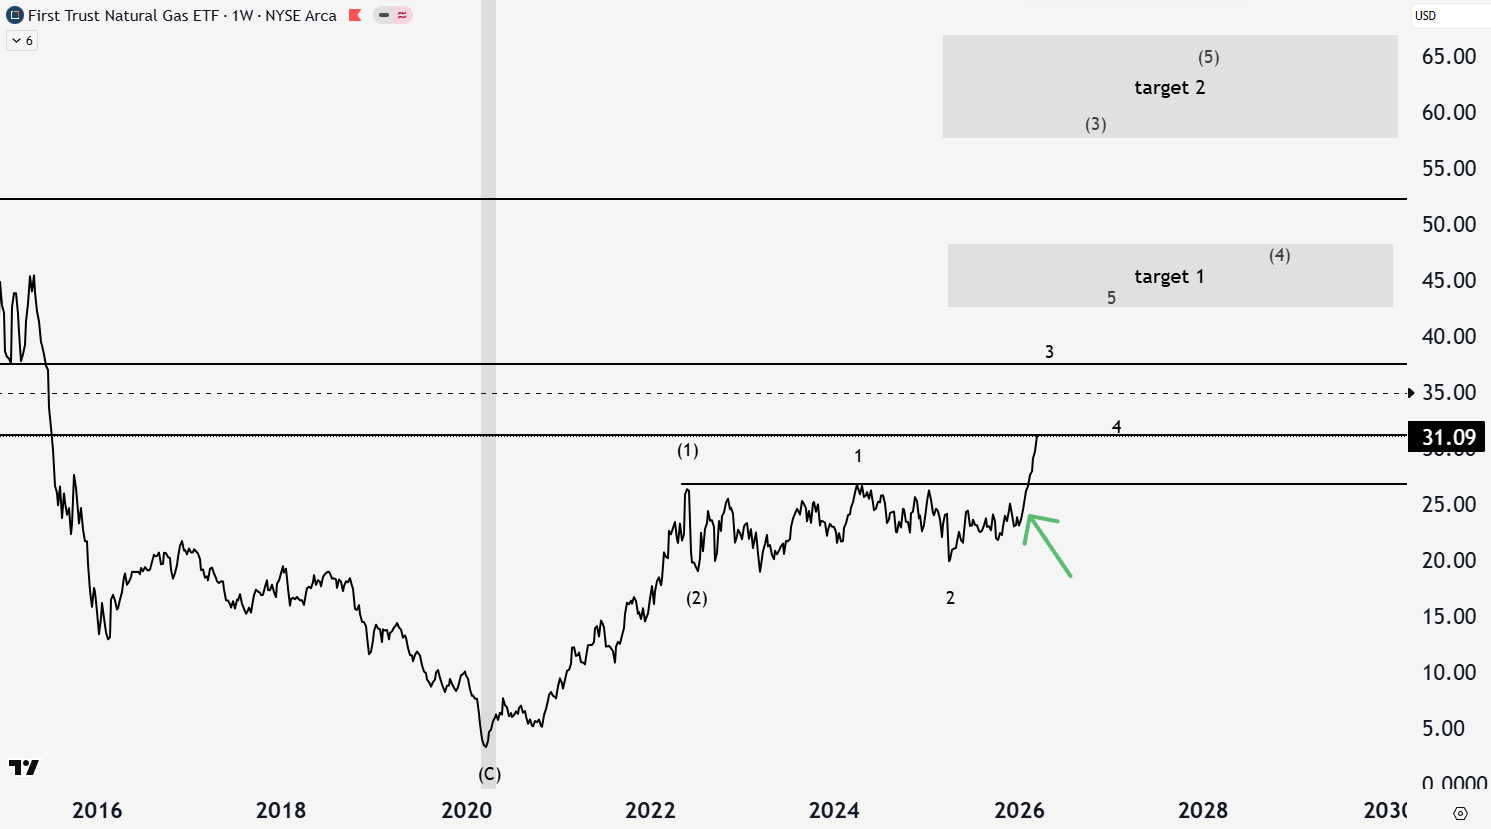
Natural Gas Companies (FCG) - 5.9%
The Iran conflict started on February 28th. I spotted this promising setup in oil/gas in my article No Love, on February 2nd (denoted by the green arrow). I obviously didn’t know that oil going through the straight of Hormuz would be blocked, sending crude and LNG prices higher.
Many times news doesn’t matter and price goes the opposite way “it should”. There are many news events or catalysts that could back my thesis, but technical analysis is useful precisely because it ignores news. Events are merely a catalyst to drive the sentiment and supply/demand of prices. It may seem obvious that the Iran conflict would drive gas stocks higher, but that is a trap that will lose money over time.
I did not predict the war, but found a healthy, unloved sector with a good technical setup, and macro tailwinds. The portfolio position is up 26.5% since then. It is testing a resistance level at $31. The next level of resistance is the line at $37 and first target box around $45. If FCG is going to really push, $60s is the upper target.
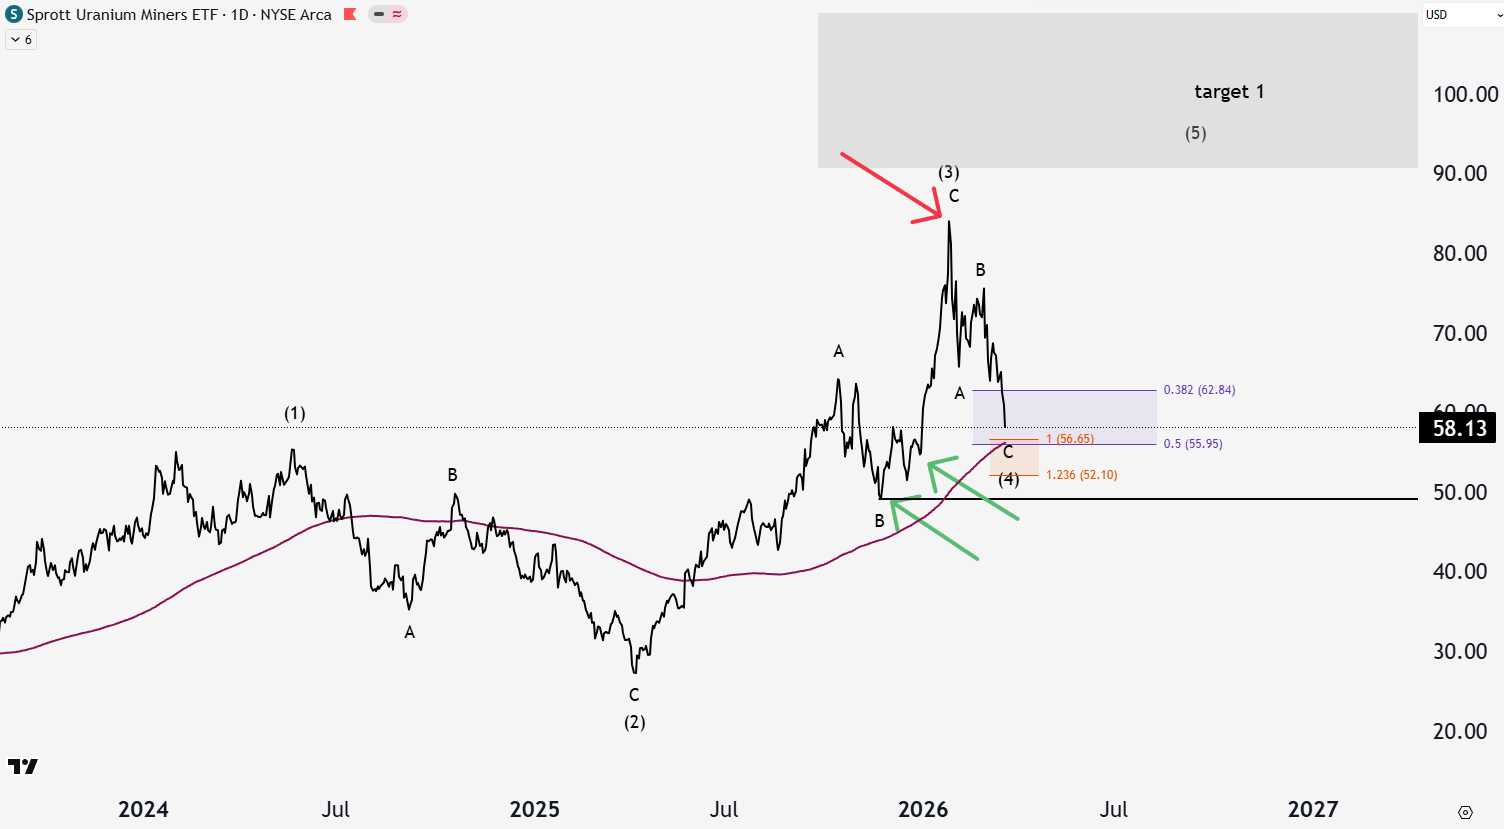
Uranium Miners (URNM) - 5.4%
Uranium has had a healthy correction alongside precious metals over the past month, but good portfolio management allows you to benefit even if things don’t go perfectly. I added URNM in November and added more December (green arrows). Seeing healthy profits so fast, I trimmed the position in January. Even with the drawdown over the last month, our position is up 19.3%.
We sit at a confluence of traditional corrective targets including wave 4 in purple, wave C in orange, 2024 price high, and the 200 day moving average. The technical picture has become messier, but this would be a beautiful spot to find legs higher. If we break below the B wave low and entry at $50, it is time to reconsider this position.
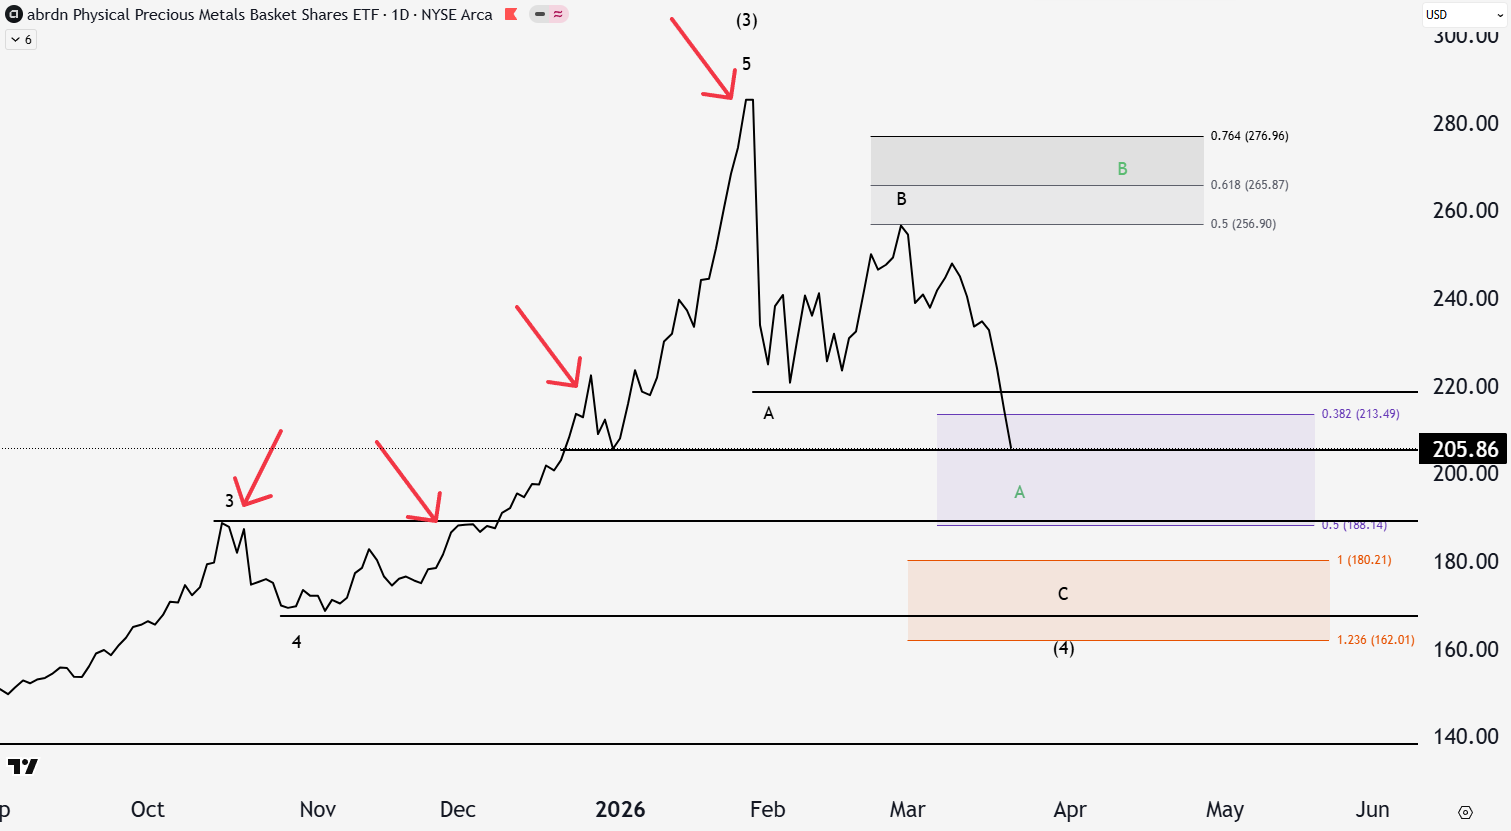
Precious Metals and Miners (GLTR, GBUG) - 4.3%, 3.2%
Gold/silver have been a staple from the beginning. They have also had a serious correction over the last month. Just like uranium, I have been taking profit all the way up. I even warned about silver’s parabolic rise and the risk for a 30-50% correction in my January update, which turned out to be quite prudent call.
The positions are still up a whopping 75% and 126%, in which we trimmed significantly in anticipation of this recent pullback. There is likely more correction to go before making new highs in metals, but the path is unclear. First, it could take quite a long time to get there as wave 4’s are typically choppy and boring. Second, whether we go directly lower through the purple (wave 4) support directly into the orange box (black ABC), or back higher before lower in the green ABC is yet to be seen. Third, there is always the possibility that this parabolic run has hit its peak already and we won’t see higher gold in a long time.
For portfolio weights and the rest of the analysis, please subscribe.
