🔋Revise To The Sky
This week I point out another leading recessionary indicator, only it’s not?
If you enjoy, press the heart button on this article! I would greatly appreciate it :)
Is the economy strong or weak? Gross domestic product (GDP) is the go-to data point for understanding the strength of economic activity. GDP is comprised of consumer spending, corporate investment, government spending, and net exports. Further, inflation has been dis-inflating from its peak levels in 2022 and the unemployment rate remains near historic lows. Along with a stock market racing to all-time highs, this is all good news for the economy going forward, right? Well, maybe…
The less-known metric for tracking economic activity is gross domestic income (GDI). It tracks wages, corporate profits, taxes, and other income sources. Structurally it is the opposite of GDP and mathematically there should be very little difference between the two indexes.
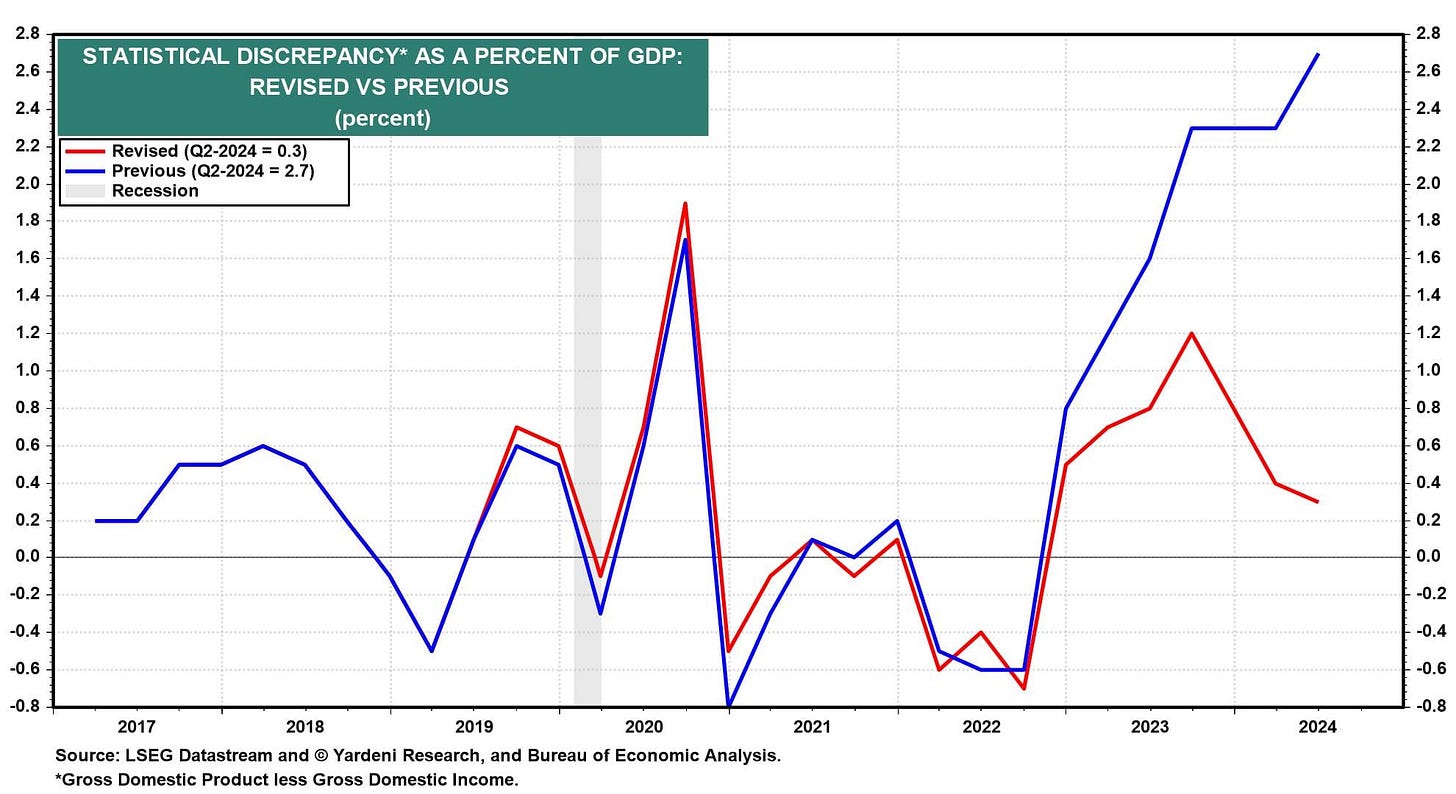
Up until last month, there was a record deviation between GDP and GDI. Deviations look very stark compared to past data, but the data is revised after a year or two. Historically GDP winds up being revised closer to GDI, which paints an ugly picture for the US economy as GDI has been flat to negative. If this is true, the economy is much weaker than most people realize.
I have also talked about other leading economic indicators like the yield curve, net national savings, employment data, and more that show a pre-recessionary economy. This gap between GDP and GDI is yet another pre-recession indicator. Last month the Bureau of Economic Analysis released revisions to the data over this period, but instead of GDP revised down to GDI it was the opposite.
The revisions were gargantuan to say the least, raising Q2 2024 GDI by a massive 3.6%. The discrepancy between GDI and GDP has been revised away leaving in hindsight a booming economy without any discrepancy to suggest future weakness.
To be intellectually honest, this is a strong indicator against any near-term recession calls. Some economists are viewing this period as another roaring 20s, and so far I cannot disagree. Instead of economic activity rolling over and correcting in a recession, it is on a solid upward trajectory. While there is always a chance that this is election window dressing, I’ll leave any speculation to readers at home if they wish.
The revised data makes my call a little more complicated. The yield curve which has always signaled significant market corrections has already been inverted the longest since the Great Depression. Unless things are different this time, we are in new territory as to how long the economy can remain resilient before a correction. Here, GDI suggests a healthy and booming economy to back up speculation and record valuation levels in stocks.
I have said we may see continued strength, especially in stocks before the inevitable correction arrives. The trick is timing. It is worthwhile paying attention to when the yield curve becomes consistently un-inverted as well as GDP and GDI rolling over once again. Until then, things can remain wacky and stocks can go ever higher.
Until next week,
-Grayson
Leave a like and let me know what you think!
If you haven’t already, follow me at TwitterX @graysonhoteling and check out my latest post on notes.
Socials
Twitter/X - @graysonhoteling
LinkedIn - Grayson Hoteling
Archive - The Gray Area
Let someone know about The Gray Area and spread the word!
Thanks for reading The Gray Area! Subscribe for free to receive new posts and support my work.


