
🔋The Great Connection
On top of last week's technical analysis, real data suggests similarities between America's greatest bear markets and today.

If you enjoy, press the heart button on this article! I would greatly appreciate it :)

Last week, I discussed the technical similarities between today and the 1929 stock bear market. While this type of analysis may seem esoteric, it is not the only reason why we are in a similar period today. Fundamentally, stocks are at high valuations similar to those in 1929 and 2000, as measured by the CAPE ratio. Further, other data points share little historical connection, which happens to be the 1929 period. History doesn’t repeat, but it often rhymes.
The inversion of the yield curve is a leading indicator of economic weakness. Its inversion and length imply there is risk in the near term relative to the long term. Most of the time investors want to be paid more for longer bonds to compensate for longer-term risks as well as inflation. Sometimes shorter-term bonds have higher yields than long, implying that there is some dislocation in the time-value of money. This is sometimes interpreted as weakness in lending markets which can lead to recession sometime in the future.
As I discussed in The R Word, inverted yield curves typically result in recession and stock market corrections, but only once the curve un-inverts. The last three inversions in 2020, 2008, and 2000 led to 20%, 47%, and 53% drops in the S&P500. Currently, the curve has been inverted for the longest period since 1929.
Since there is some correlation between time inverted and a negative effect on the stock market, I looked back in time to find the longest periods of inversion. Long to short interest rates were inverted for nearly 2 years (730 days) preceding the great depression, kicked off by a stock market collapse of 89%. This aligns with the same magnitude wave we may be entering as I discussed last week. Unfortunately, the Great Depression was a hard time for the US but made worse through interventionist policies at the time.

The next worst event was the 2008 recession which was inverted 270 days and the stock market dropped 53%. Today, the 10yr-3mo yield curve has been inverted for 727 days and counting. We have long surpassed the second-longest yield curve inversion and are about to pass the 1927-1929 inversion as the longest.

As long as we hang out in the inversion region, things can seem good in the economy which is what we saw then and now. People are often quick to point out the omen of the yield curve but fail to realize it takes time to materialize in a recession. Even during the longest inversion of the 1920s, the stock market melted up 80% over less than two years all while the yield curve was inverted. The infamous stock market panic marked the end of the inversion and the market went down 43% over the next few days, before an ultimate 89% haircut in the stock market in the bear market that followed.
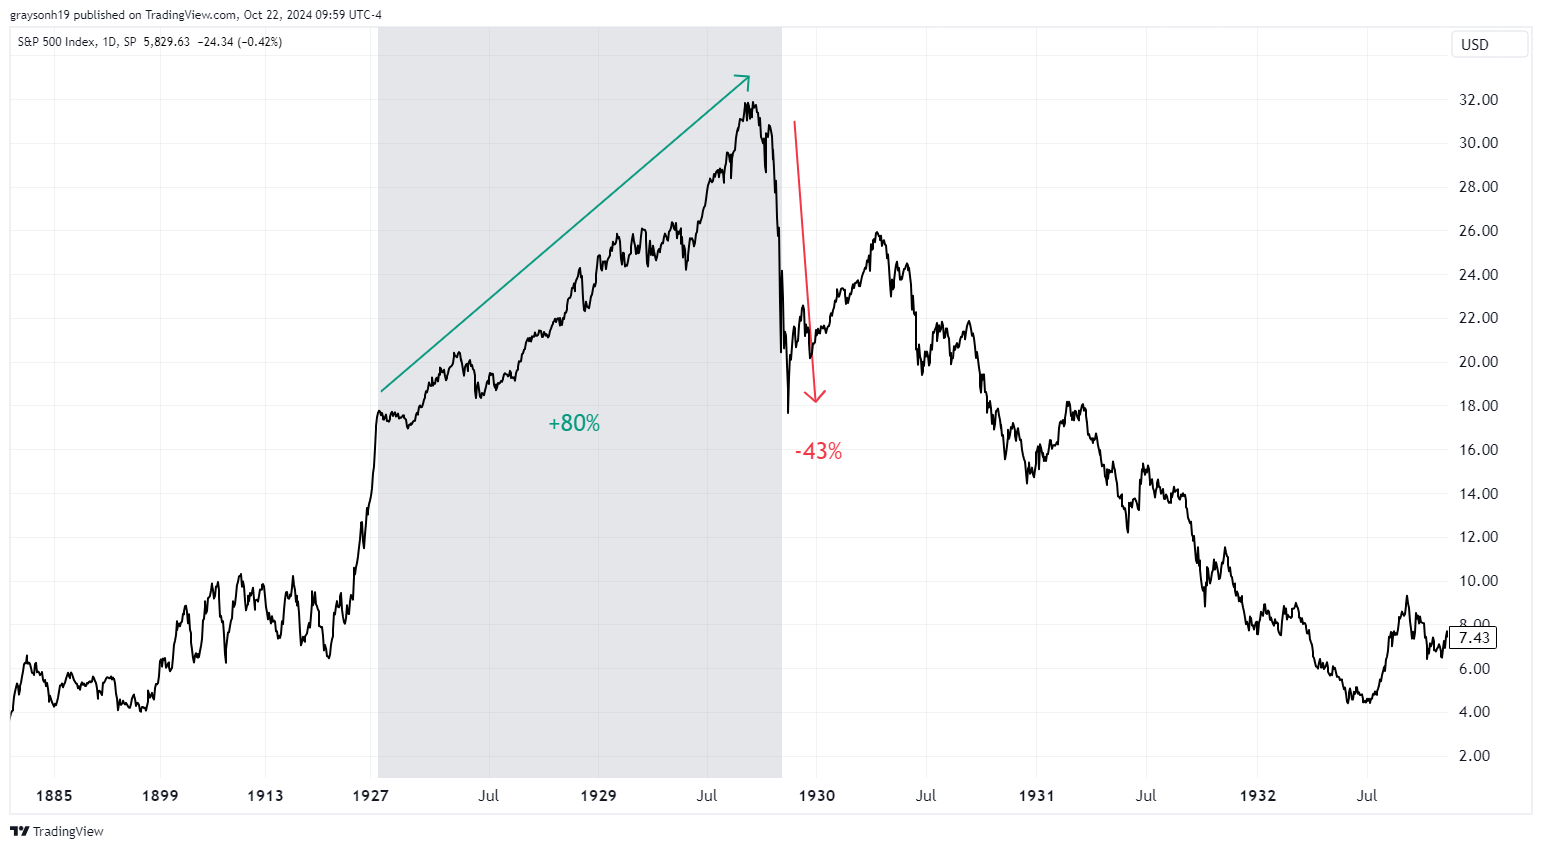
This is not too dissimilar to now, as we have seen a 66% move higher in the S&P 500 over the last two years with momentum to the upside still. History suggests recession once the curve below goes back above zero. At some point, the yield curve will un-invert and the grey box will end, which should cause a market correction at best and supercycle wave IV/great depression like bear market at worst.

Unfortunately, this is not the only indicator at 1929 levels. National savings are typically correlated with the health of the economy. The savings of government, businesses, and consumers decline sharply into recession as people run out of money and/or lose their jobs. Only twice in history has the savings dipped into negative territory, in 1929 and 2008. Business and consumer activity is funded through savings at the end of the day. Credit does drive much of the economy today, but it is an extension or leverage on savings.
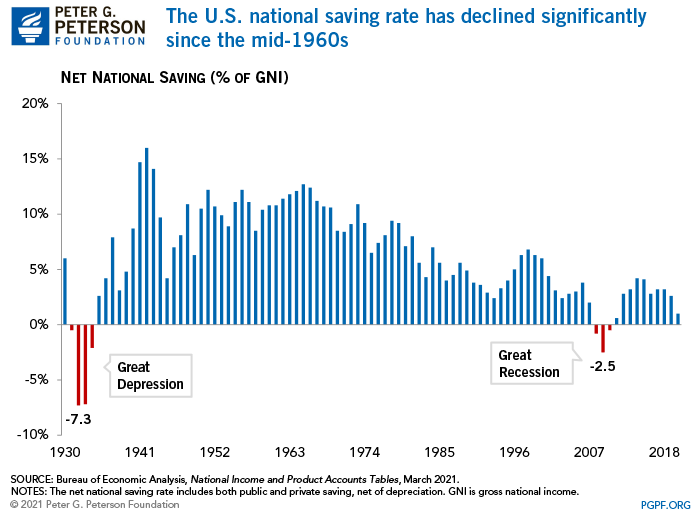
The figure above shows up to 2018, but new data shows that savings are in negative territory now. How long governments, companies, and households are willing to fund economic growth with unsustainable debt is hard to predict, but history shows it to be unsustainable. In the past when the underlying savings that debt is levered on top of goes negative, we have seen the two worst economic outcomes in US stock market history.

Being early is also to be wrong. I was surprised to see the yield curve inverted as long as it has and defied the average yield curve inversion. The recession that typically follows inversions has not happened, at least yet. This however may be a different time, with a bigger magnitude like in 1929 which is why it has acted in such a way. I often struggle with who am I, just one person to know what will happen with the market, but at the very least it is just real risks to be aware of. It is always possible that the market can defy these expectations I have laid out, but the evidence is continuing to mount against it. Until next week,
-Grayson
Leave a like and let me know what you think!
If you haven’t already, follow me at TwitterX @graysonhoteling and check out my latest post on notes.
Socials
Twitter/X - @graysonhoteling
LinkedIn - Grayson Hoteling
Archive - The Gray Area
Let someone know about The Gray Area and spread the word!
Thanks for reading The Gray Area! Subscribe for free to receive new posts and support my work.
And another eerie parallel to the Depression Era--sommering conflicts in the Pacific (Taiwan) and Europe (Ukraine) with elements of antisemitism --oddly enough here in the US, along with a potential quasi-fascist president being elected.