

If you find this article interesting, click the like button for me! I would greatly appreciate it :)

The stock market is among the most expensive in history along many valuation metrics. That doesn’t help with timing a major top, but gives the conditions necessary for one. The traditional buy-and-hold stock market strategies have worked since 2008, but recency bias has blinded people to the wealth destruction that 50%+ drawdowns cause to a portfolio and the immense difficulty of regaining it. It is therefore of utmost importance to know when to reduce risk in this environment. Using technical analysis, credit/bond market analysis, macroeconomic analysis, and sector analysis, we can have a better idea than almost everyone.
Techincal Analysis
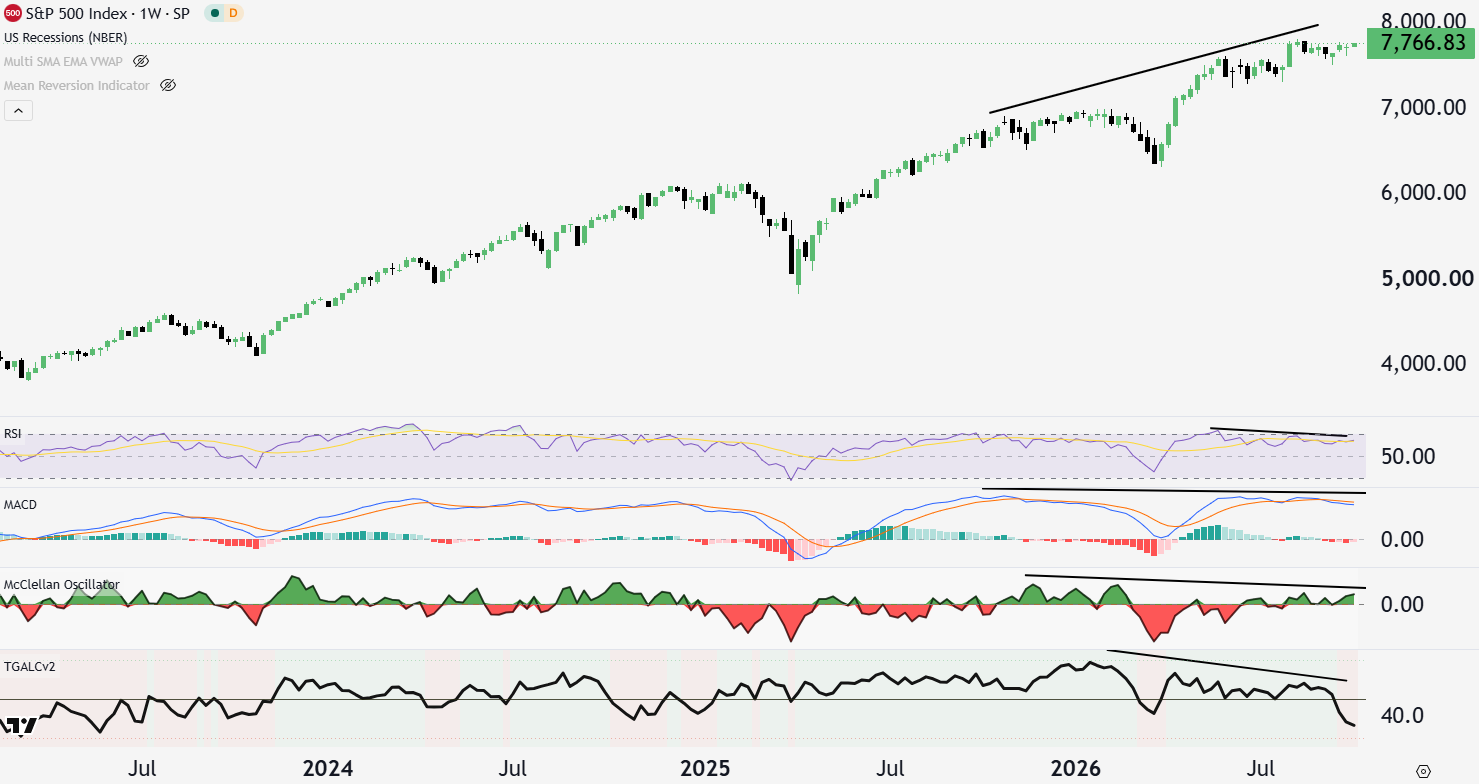
As I discussed in Thin Ice, the market often warns you before major tops. Momentum indicators like the relative strength index (RSI) and moving average convergence/divergence (MACD) can give insight into a market running out of steam. The McClellan Oscillator is a breadth indicator, showing how many stocks are positive and contributing to the move. Finally, the Gray Area Liquidity Conditions (TGALC) shows a proprietary measure of market liquidity (i.e central bank liquidity, bond market volatility, dollar strength, overnight financing, etc.). Deteriorating liquidity conditions often precede market weakness. If the market is going up and these indicators are going down, it precedes major tops and is referred to as negative divergence. Divergence in TGALC has preceded the 2025, 2022, 2020, 2015, and 2008 tops.
There is negative divergence on every one of these indicators on the weekly timeframe right now. Momentum, breadth, and liquidity are decreasing as the price moves higher. This is a major sign of underlying market technical weakness. Since it is the weekly timeframe, the market can go higher still in the immediate and short term, but this happens before major tops like 2022, 2020, 2008, and 2000.
Bond Market
Anyone can look at a chart and say it is going to go down, but the underlying health of credit and the economy is the true story. If things are really going to hit the fan, watch credit conditions.
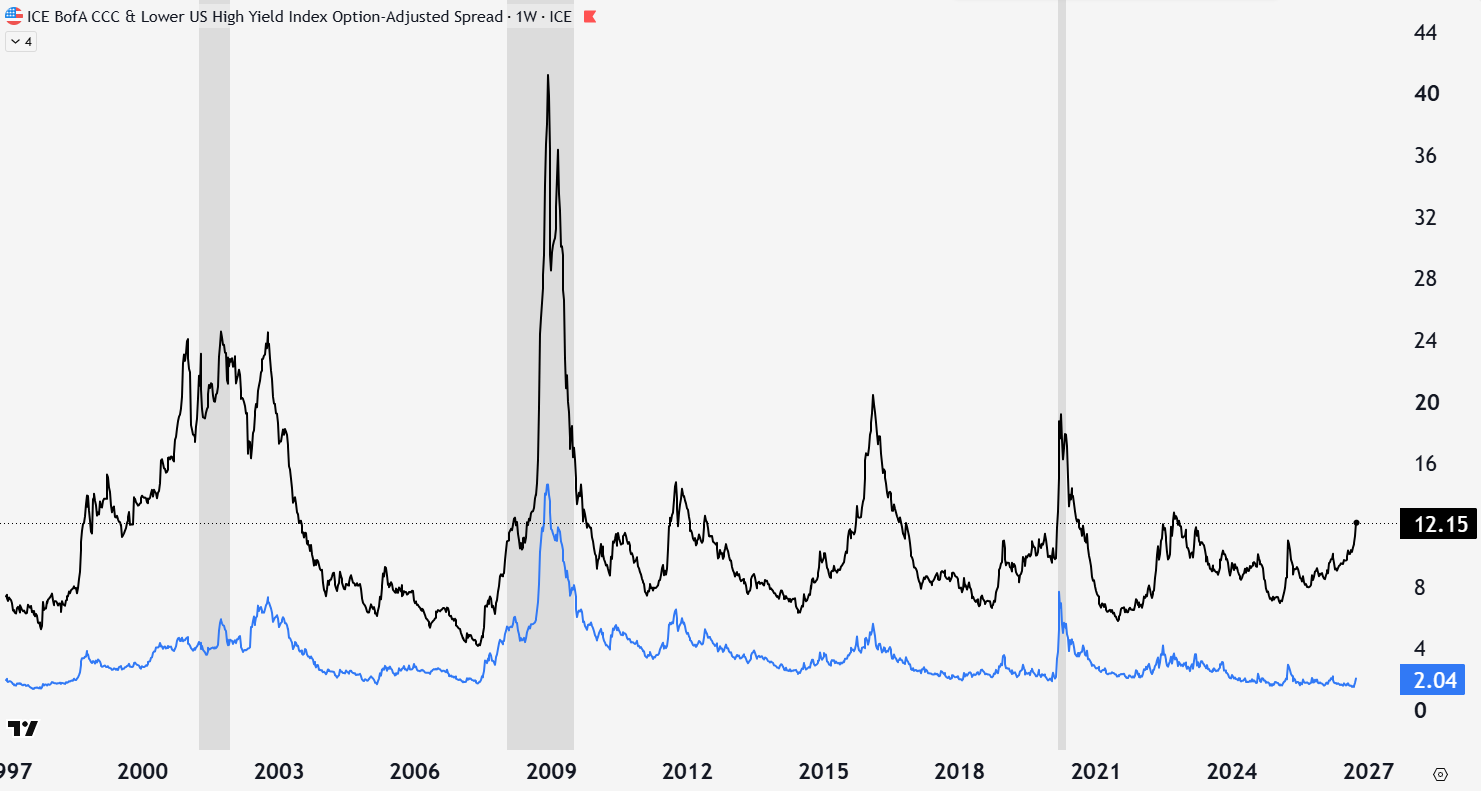
Credit spreads show the yield for certain bond grades relative to safe Treasuries of the same duration. When spreads are low, it means the market doesn’t see much risk of default. When spreads are high, it means the market doesn’t want the riskier bonds and demands a much higher premium for the risk. While they won’t say it on the news, bond investors often can see the credit risk before it happens.
Risky junk bond spreads have risen rapidly over the last few weeks and are at levels last seen in 2022. Junk spreads rose to this level before the 2008 Financial Crisis (GFC), before blowing out even further. Spreads on higher quality bonds (BB+) are also showing a small increase, but still insignificant in the grand scheme. Lower quality spreads rise quicker and earlier than higher-grade bonds during stress and are starting to move.
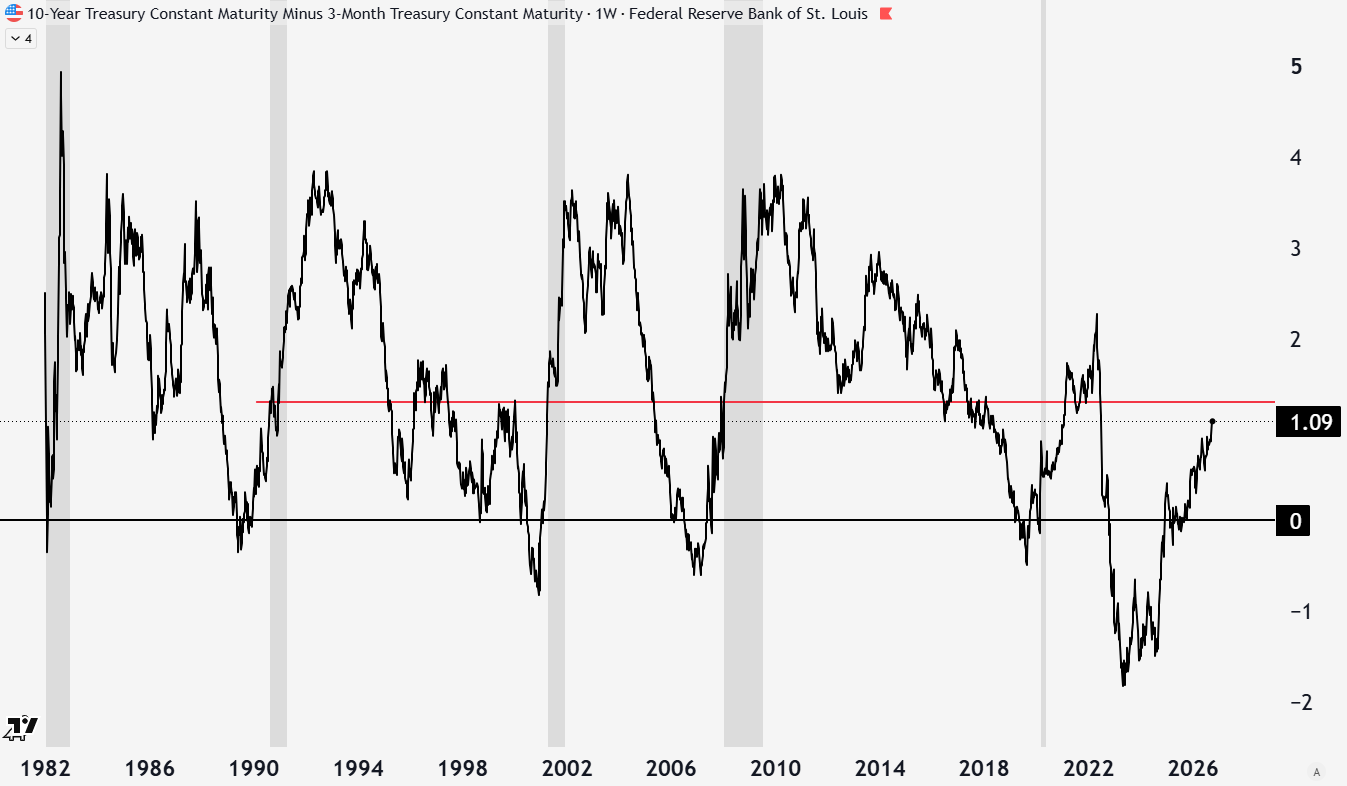
The yield curve is an important economic indicator that compares long- and short-duration bonds. Short rates are dictated by T-bill supply, money-market, and reverse repo market demand. Long rates are more economically tied to liquidity and debt refinancing (GDP+inflation+risk premia). When the yield curve un-inverts back to a 1.3% difference, we are in a recession historically. The 10y-3mo curve has an 8/8 recession prediction track record back to 1968.
The current un-inversion is at 1.09%, nearing 1.3%, but has been driven by long yields rising faster than short yields. If that case remains, it is healthier and the soft landing case is more likely. Many times in the past, there is a yield spike before yields top, and falling yields and recession inevitably follow. I will be watching for long yields to top out and go lower, along with the continuation of a rate-cutting regime. Historically, yields top first, followed by stocks, and then commodities.
Economy
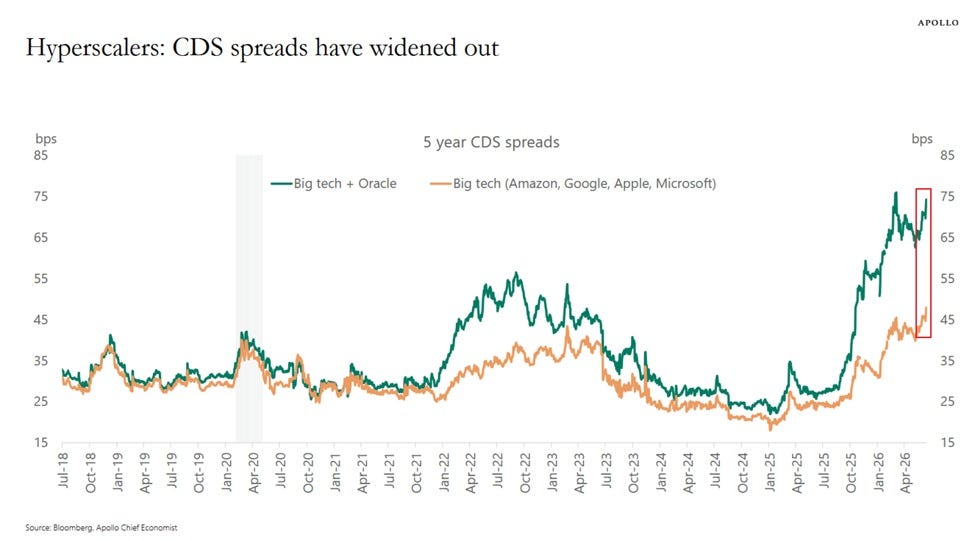
AI capex is quite literally holding together the entire economy at this point. One of the main players involved in the buildout and circular financing schemes is Oracle. Credit default swaps (CDS) can be thought of as insurance against a company default. Oracle CDS spreads have widened more than in the 2008 GFC. Even the hyperscalers, which are the best and most profitable companies in the world, have seen a sharp increase in their CDS since a year ago.
We must talk about the fundamentals of the companies powering the AI mania. From Anthropic's leaked IPO prospectus (reported by major outlets but should still be taken with a grain of salt), the company reported a 2025 loss of about $42 billion. This is misleading, as $34 billion was a non-cash charge tied to investor funding, so the number that matters is the ~$8 billion operating loss on $4.6 billion of revenue. Revenue is growing fast this year, but we have to wait to see the verified operating income for 2026.
The company has committed $518 billion to compute over about 10 years, a fixed obligation of roughly $52 billion a year against revenue that does not match that yet, and a cash reserve of only ~$20 billion. ~25% of revenue comes from two customers, showing extreme dependency risk. Finally, falling token costs mean usage must grow faster than prices drop merely to maintain revenue. A very large chunk of revenue comes from sales by Google, who are a competitor given their own models, which gives further reason to worry about the financial picture.
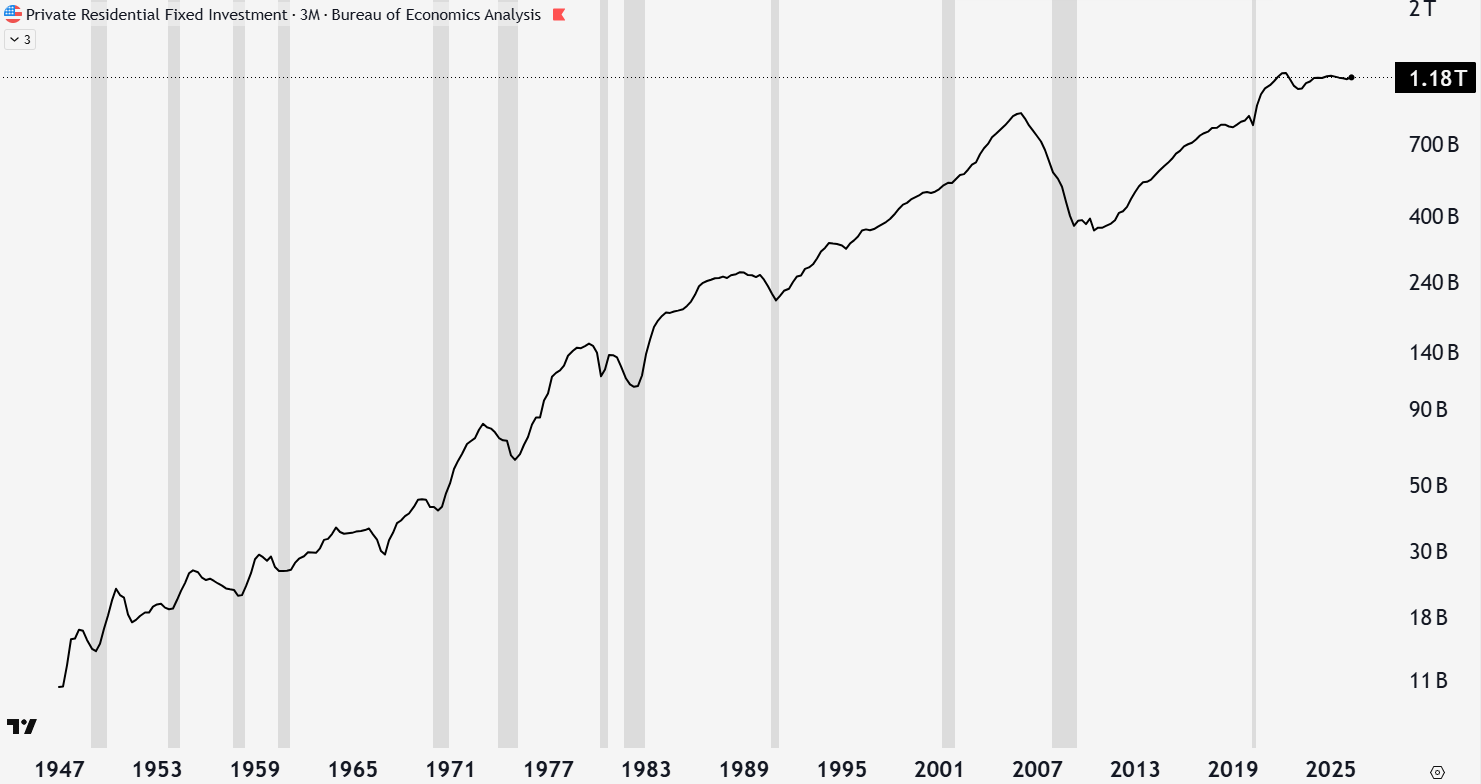
Back to the broader economy, leading indicators show where the cyclical economy is headed before it actually shows up in the GDP or unemployment data. Private residential fixed investment (PRFI) is new residential construction and improvements. This indicator, among others like deterioration in full-time employment, shows the cyclical weakness of the economy and its employment engine before the stock market tops and recession appears.
Sector Analysis
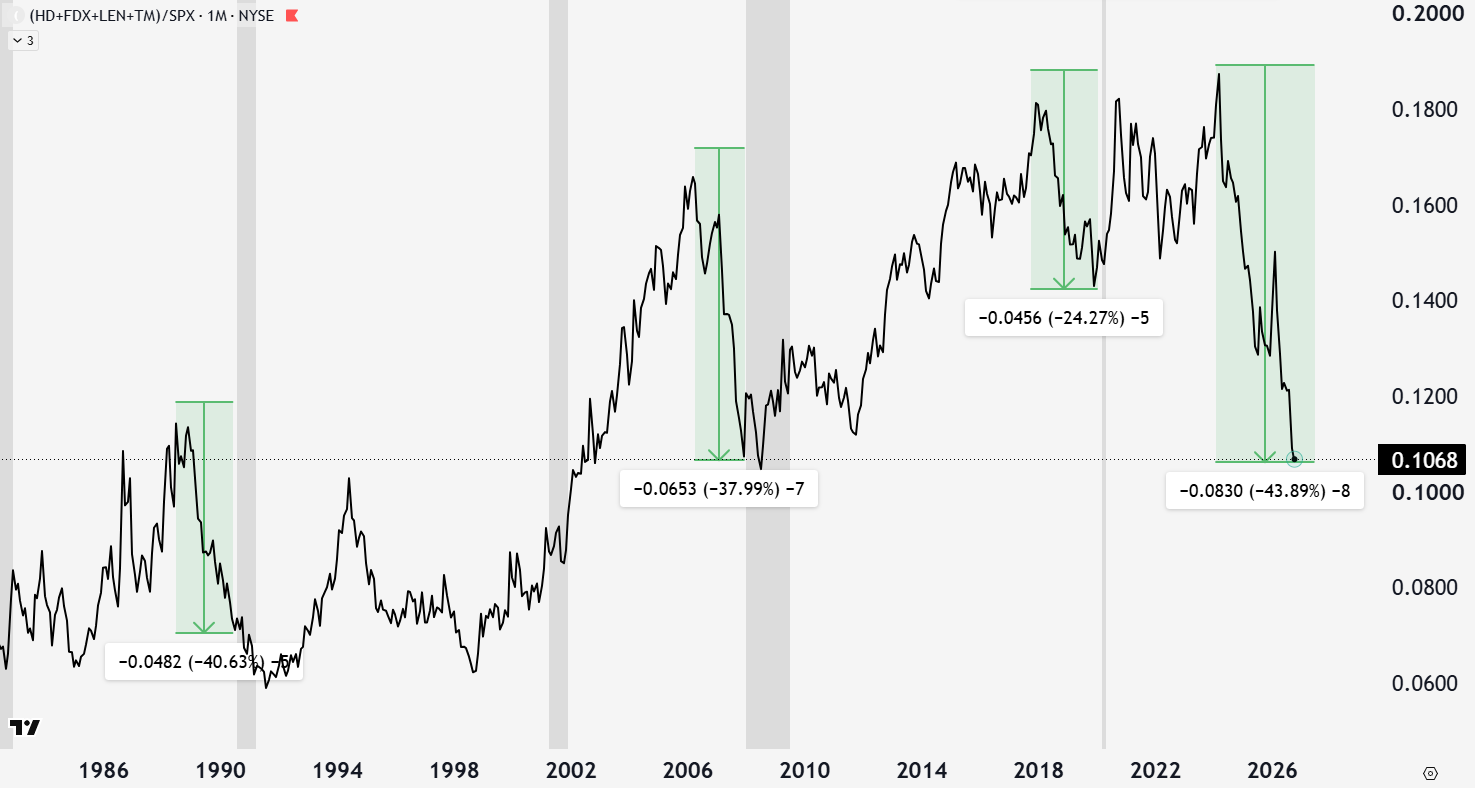
Next, pick your favorite basket of consumer discretionary stocks, and they’ve likely performed horribly as of late. I’ve chosen Home Depot, FedEx, Lennar, and Toyota to get a mix of home improvement, shipping, residential equipment, and automobiles (you can also just use the equal-weight XLY ETF). When there is economic pressure, consumers and businesses slow spending on non-essential purchases, which shows up in these companies.
These companies typically massively underperform before a recession. This basket is currently down 43% relative to the general stock market, the most ever. Similar price action can be noted with the financial sector (XLF/SPX) and transportation sector (DJT/DJI). The 2000 recession wasn’t as bad for consumer spending because it was primarily a repricing of corporate risk and valuation. Ironically, now we have both a technology bubble and consumer weakness.
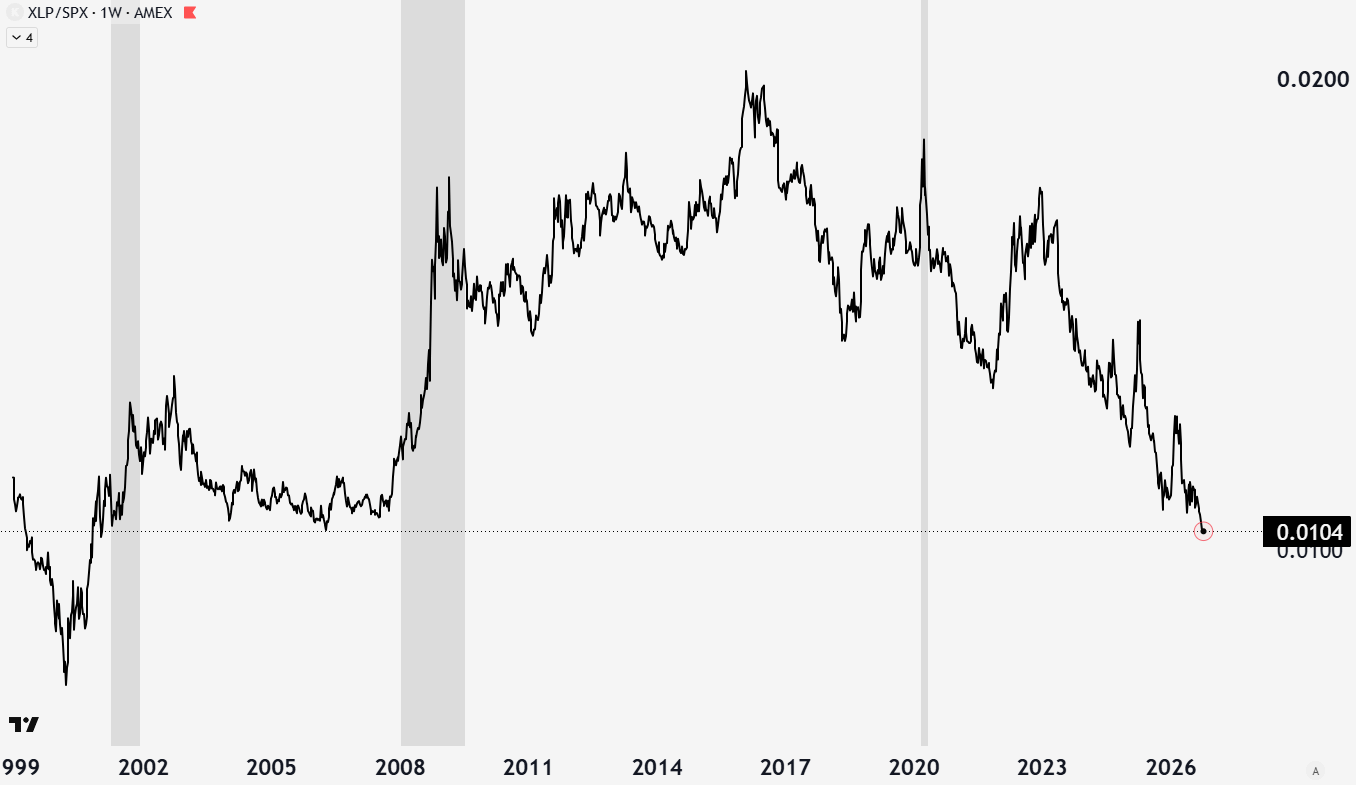
Consumer staples (XLP) are the right stocks in a recession because their earnings are less affected by consumer saving, credit stress, and bubble contagion. People still need food, medication, and consumables regardless of their economic environment. They do not have the same predictive ability, but tend to outperform during and prior to a recession. Right now, the market is giving a massive discount to consumer staple stocks relative to the general market.
We have the technical, credit, and economic warning signs of a major top in the stock market. Credit stress is rising, the cyclical economy is slowing, the AI theme is showing cracks, and the technical analysis looks ugly. How will you prepare?
A buy-and-hold strategy doesn’t work when it wipes out half of your wealth and derails your wealth-building journey. Try real diversification instead of rotating into other stocks that will also lose half of their value. The Gray Area Model Portfolio shows you how to diversify for multiple scenarios, weighted for the most likely economic outcomes. It also teaches technical analysis for knowing when to buy and sell from positions, position sizing, and risk management on current positions. Upgrading your subscription with the button below is quite cheap for the performance and value of the content.
-Grayson
Like to see these asymmetric opportunities synthesized into a real model portfolio that beats the S&P 500 and avoids major downside risks?
Socials
Twitter/X - @graysonhoteling
Email - thegrayarea55@gmail.com
Archive - The Gray Area
Notes - The Gray Area
Promotions
Sign up for TradingView
For educational and entertainment purposes only. The Gray Area should not be taken as financial advice.