
Model Portfolio: April 2026
Speculation returns to the market as we book profits in some positions.

If you find this article interesting, click the like button for me! I would greatly appreciate it :)
The model portfolio was made public in July 2025. It has 5 main components: stocks, bonds, cash, real assets, and alternative assets. Last month’s performance have been:
In March, the portfolio weathered the market downturn much better than the SPX. SPX has been on a historic run in April, but we are still up 1.74% and outperforming year-to-date.
This model portfolio is now for paid members and this is the last chance to get the 30% discount! [In just the first 4 months of 2026, a mere $1000 would’ve covered the entire yearly $70 subscription].
There are three themed research articles each month and one paid model portfolio update.
You get up to date portfolio changes, allocation decisions, technical analysis, and synthesis of all the research pieces into an actionable plan. To beat the market and know how to not get destroyed in a bear market, please consider joining with a premium subscription.
Here’s a preview of two etfs in my real assets bucket.
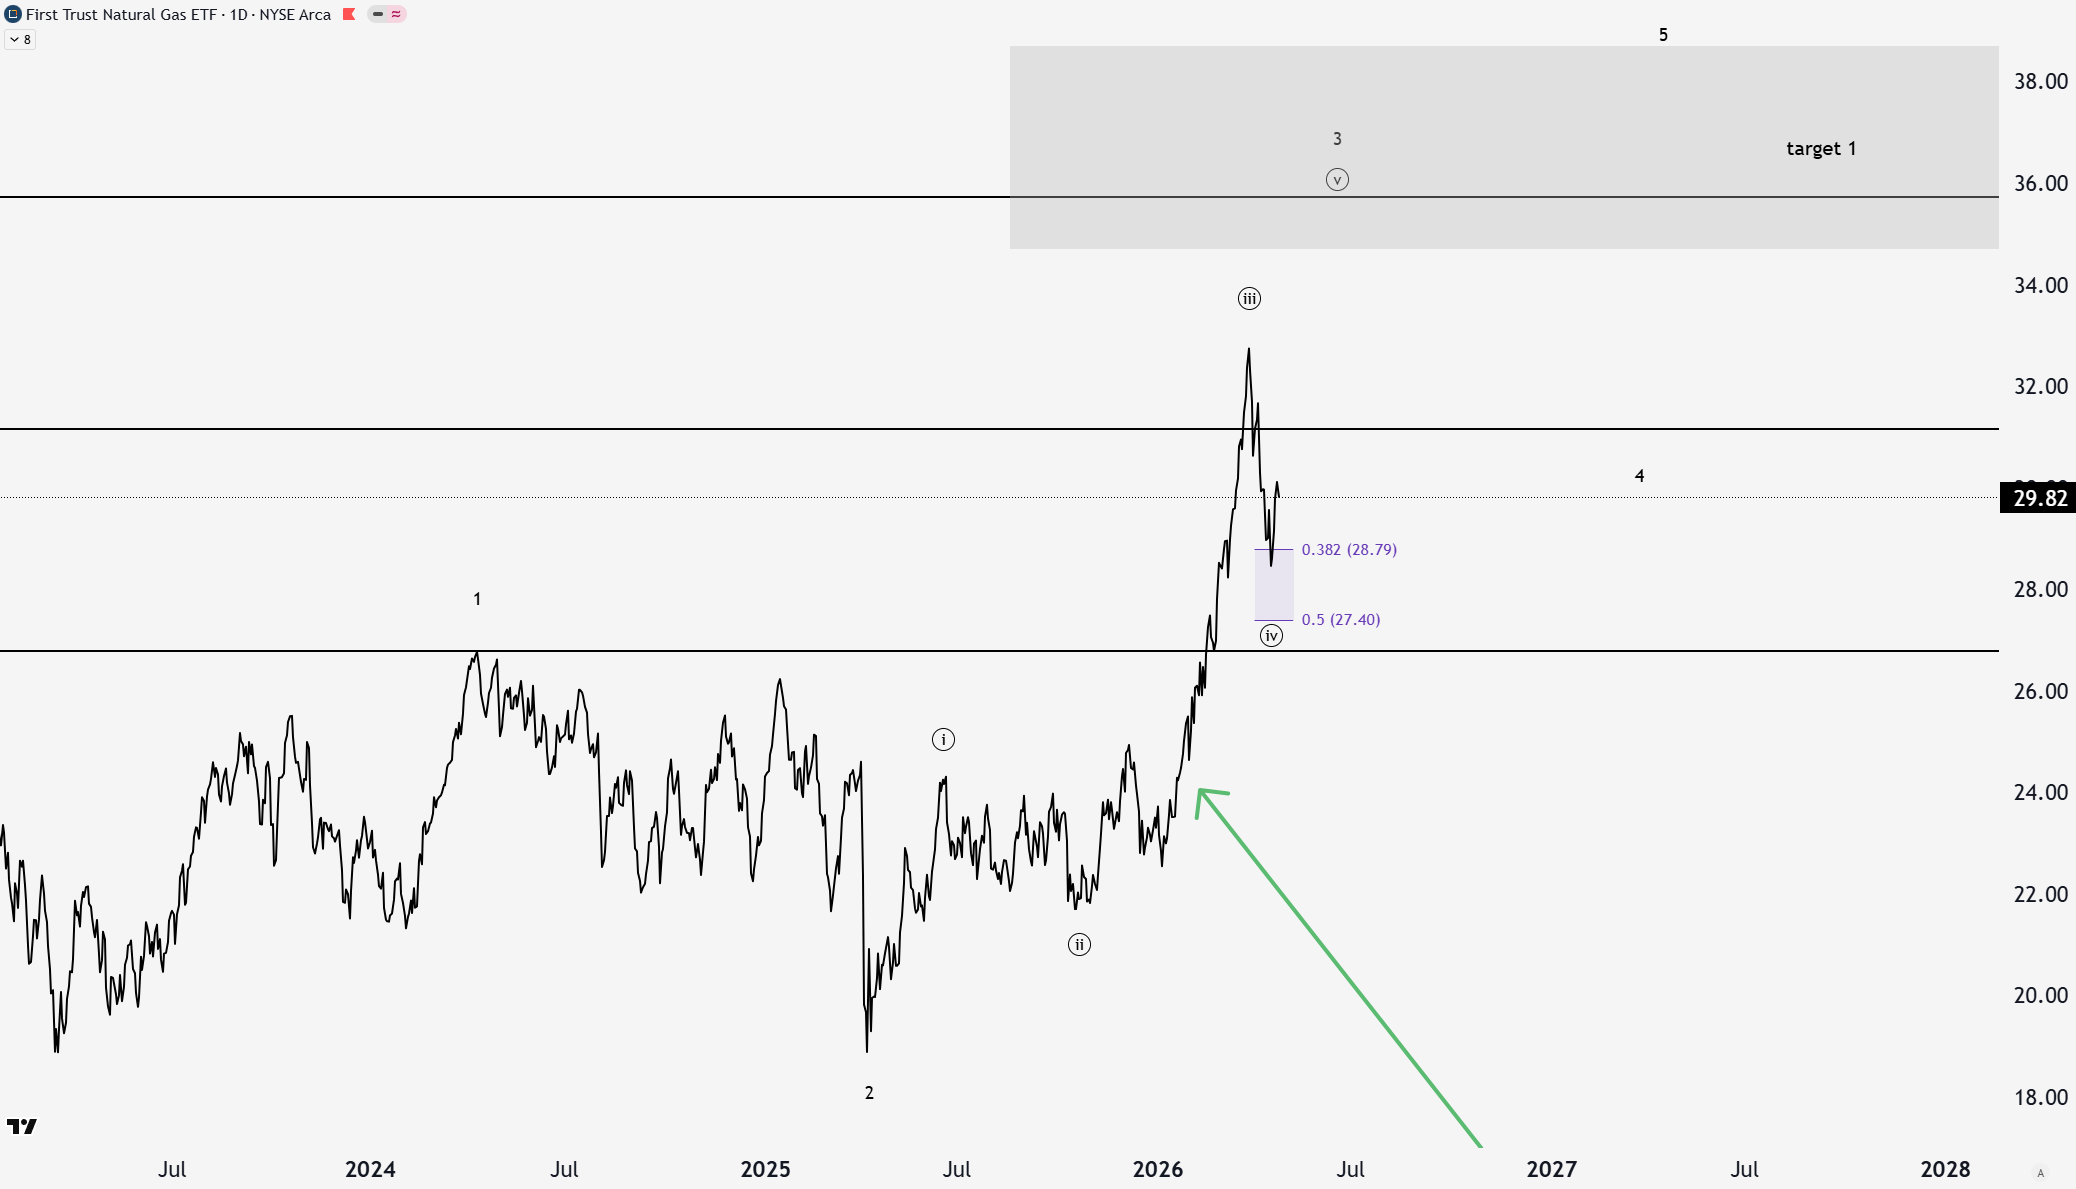
Natural Gas Companies (FCG) - 5.8%
The Iran conflict started on February 28th. I spotted this promising setup in oil/gas in my article No Love, on February 2nd, around the time it was added to the portfolio (green arrow).
I obviously didn’t know that oil going through the straight of Hormuz would be blocked, sending crude and LNG prices higher. This shows the power of technical analysis and key levels. The news doesn’t matter other than being a catalyst for volatility (i.e good earnings report → stock down). It may seem obvious that the Iran conflict would drive gas stocks higher, but unless you’re an insider, trading the news is a fools errand. Plus, FCG went up 20% before the conflict even happened.
This portfolio position is up 21.96% total. It broke through the resistance level at $31 to finish circle wave iii. It bounced off the perfect circle wave iv support. The target for the next leg higher and take profit zone is $35, with Fibonacci levels and past price resistance in that area. If FCG is going to really push in the long term, $60s is the upper target.
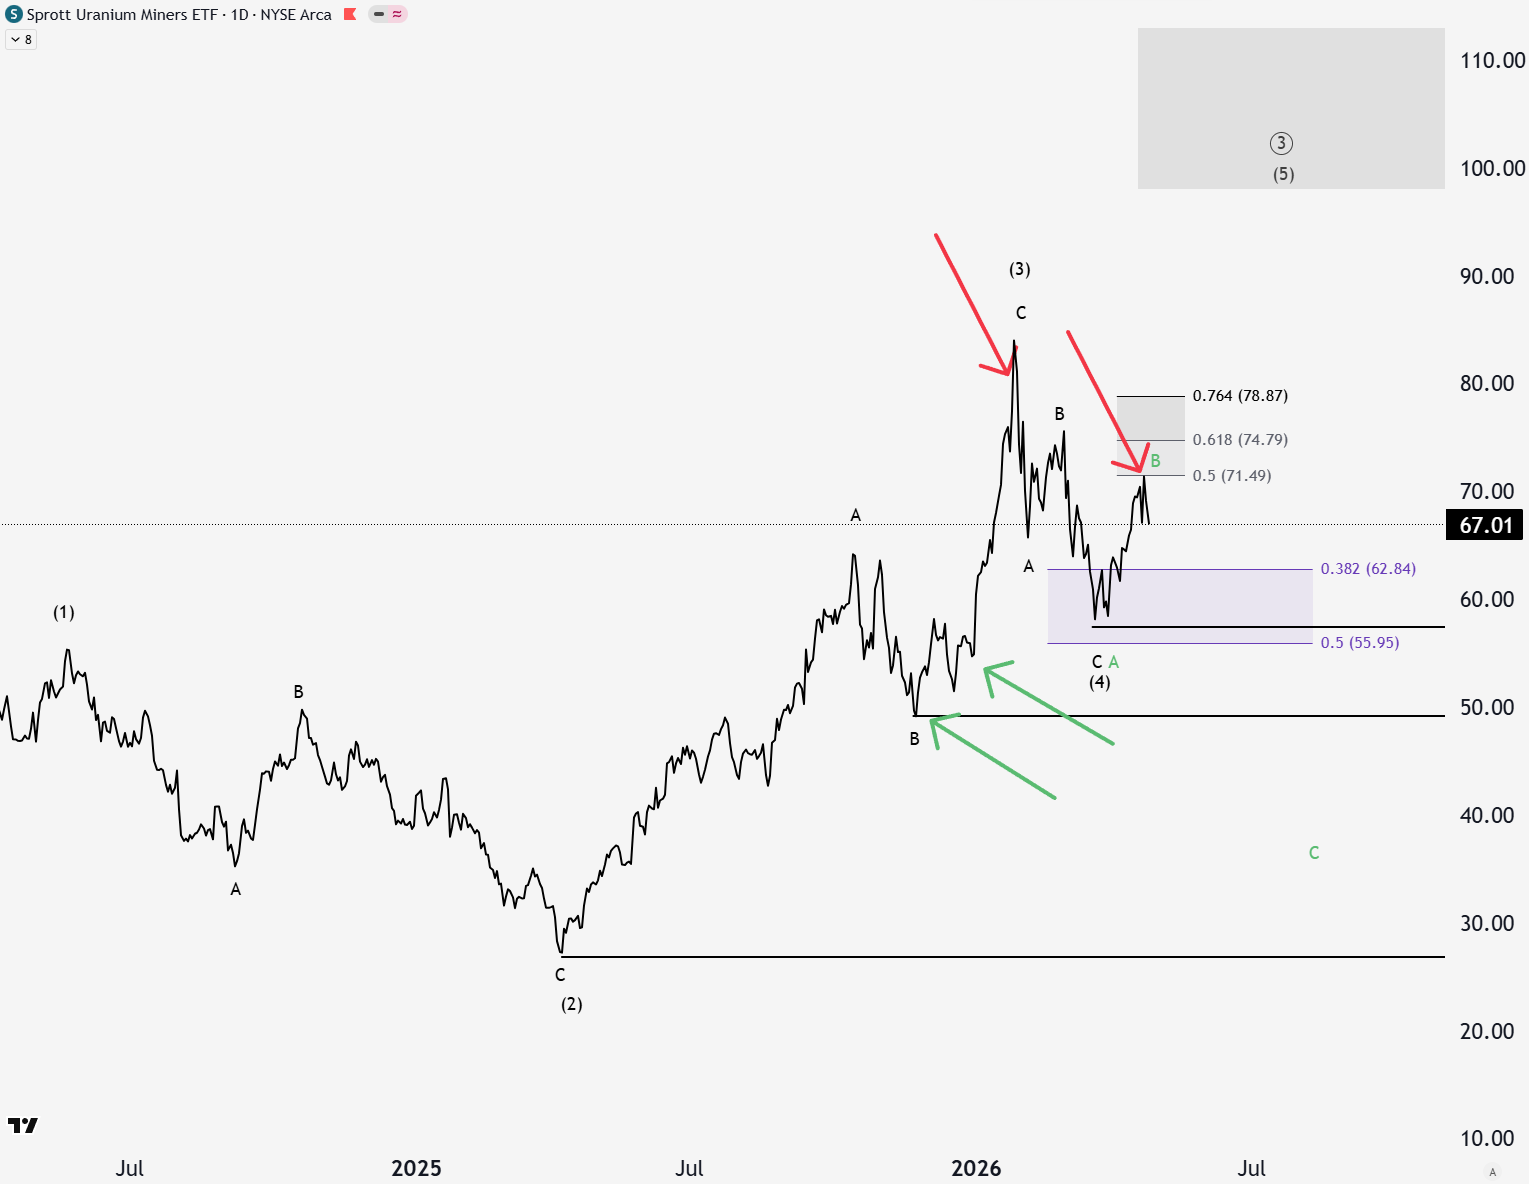
Uranium Miners (URNM) - 6% → 5%
Uranium has been largely moving with precious metals. The past month saw a 5.93% move up off of the ABC correction into the purple wave (4) support.
I added URNM in November and added more December (green arrows). Seeing healthy profits so fast, I trimmed the position in January. The position is up 31.6% in total.
The technical structure I have labeled is ugly and not high confidence. There is a chance it is building out a larger ABC correction so it is prudent to reduce risk and book some of our profits in Uranium.
For the full portfolio breakdown and analysis, please upgrade your subscription.