
Not So Bright Pt. 3
More evidence of the sun's impact on GDP and stock prices.

If you find this article interesting, click the like button for me! I would greatly appreciate it :)

The Jevons paradox is that when a technology becomes increasingly efficient, the overall consumption increases, not decreases. This is paradoxical because, with greater efficiency, fewer resources should be used. However, as technology advances, increased demand offsets efficiency gains. Computers, oil, and electricity are prime examples.
Jevons was also researching the solar cycles’ relationship to economics. Unlike his technology paradox, his solar cycle work did not garner mainstream recognition. He studied the solar cycles’ relationship to wheat prices from 1760 to 1810.
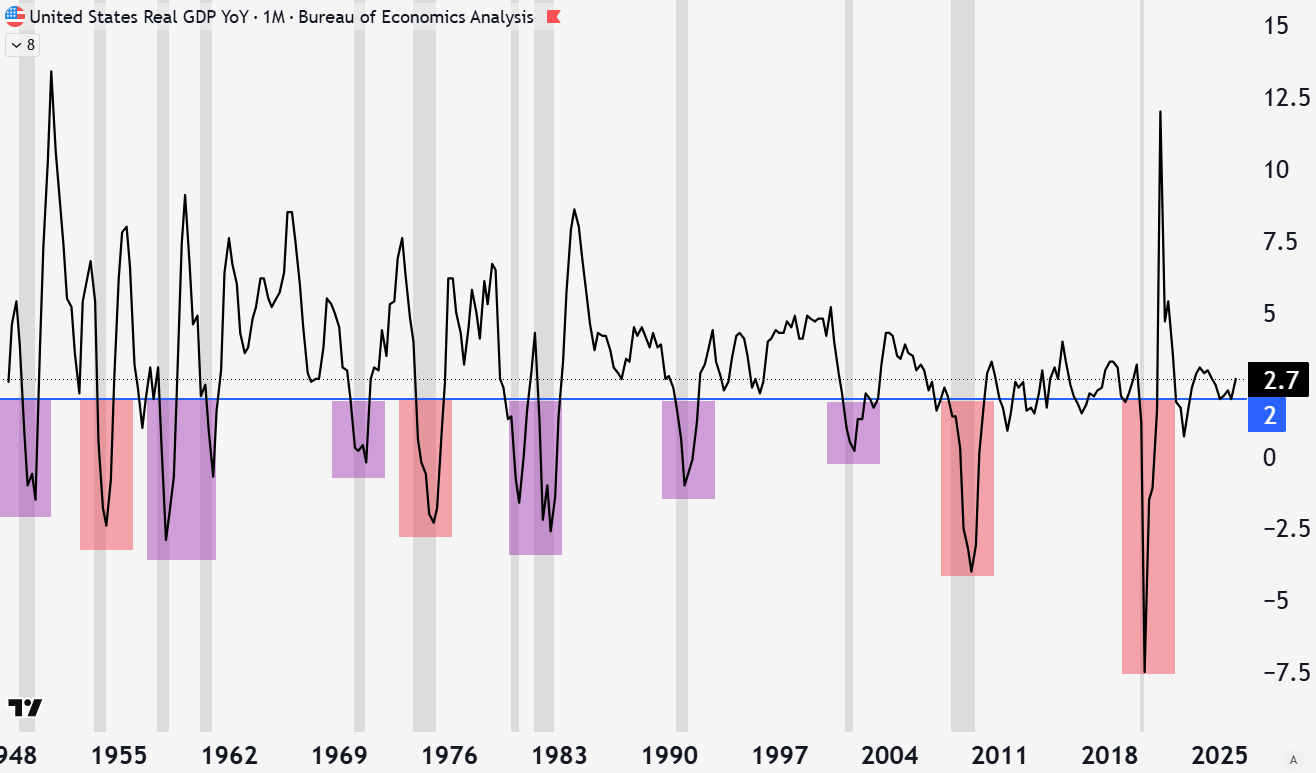
Today, we don’t have to approximate economic activity with wheat prices. GDP data is robust and has been that way for decades, enough to compare to the 11-year solar cycle. A Russian economist, Vladimir Belkin, has a preprint out looking at this very relationship. The paper shows a strong correlation between the solar cycle and GDP. It even proposes a neurochemical mechanism: UV radiation → serotonin/melatonin → economic optimism or pessimism → GDP growth the following year.
In Not So Bright, I introduced this concept and showed how unemployment spikes and stock market volatility are often concentrated around solar maximum. It is actually more likely than not to have poor stock returns around solar maximum. Then, in Not So Bright Pt. 2, I connected this to agricultural commodities specifically.
There are numerous scientific articles linking geomagnetic storms to things like the central nervous system of mentally ill patients, happiness levels, mood, depressive episodes, heart issues, lung issues, decision-making ability, white blood cell count, circadian rhythm, and more.
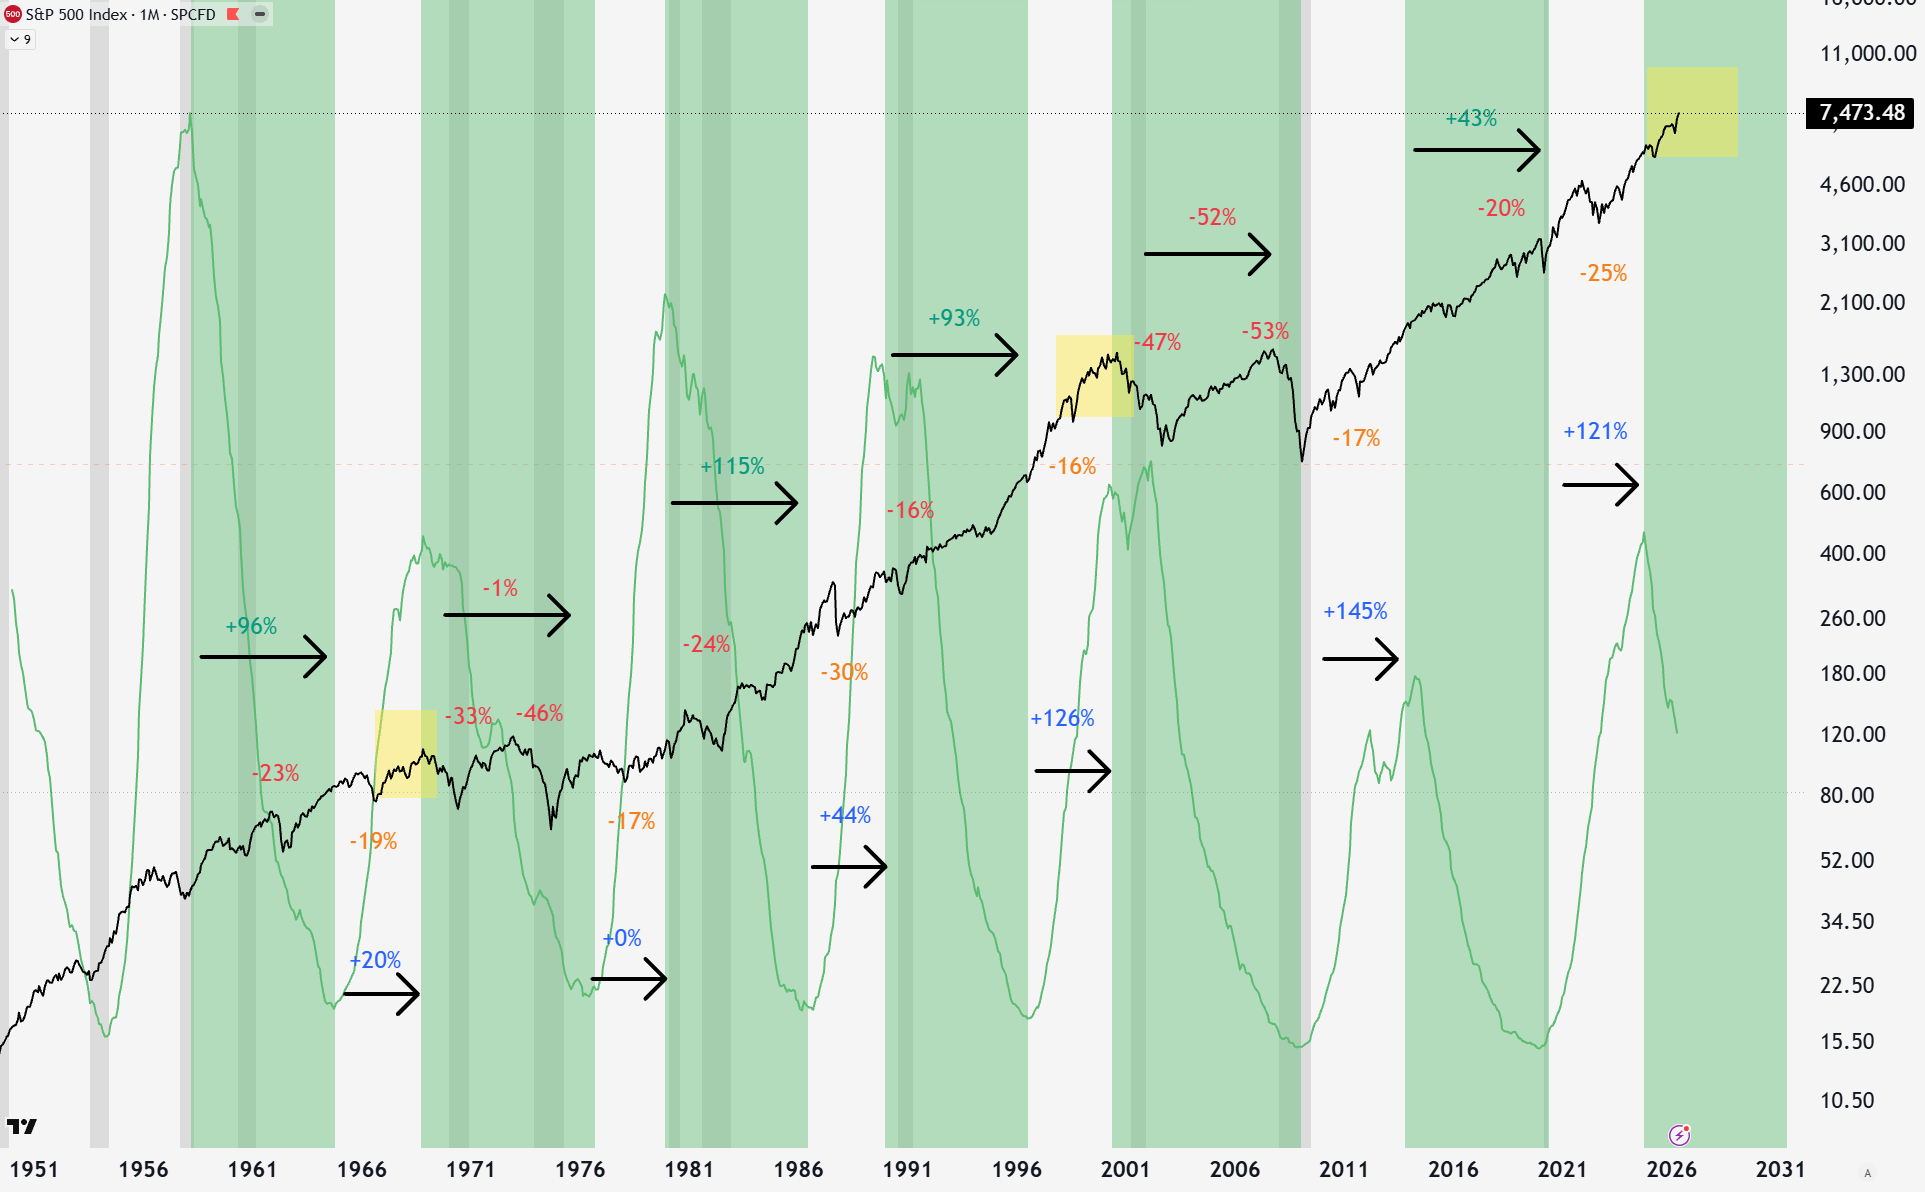
Regardless of the mechanism, I wanted to expand on my solar cycle and stock market analysis since it is clear we hit solar maximum and are now in the declining phase.
Comparing the increasing/decreasing phases, there is a big difference. Risk-adjusted returns in the increasing phase are much better. The decreasing periods shaded in green tend to have larger drawdowns and lower average returns. You never lost money in an increasing solar cycle phase, where there were two lost decades during increasing solar cycle phases, the 1970s and 2000s.
We can get more clues about why these lost decades occurred, and they both were at valuation extremes, denoted with yellow boxes. We just began the declining solar cycle phase at a valuation extreme, meaning we are primed for a potential lost decade if history rhymes.
During solar maximum, geomagnetic storms impact humans in the ways mentioned above in the literature. During solar minimum, the low sun activity protects the Earth less from galactic cosmic rays, resulting in their own biological impacts on humans.
Going back to Belkin’s paper, he suggests that it is extremes in the solar cycle that cause disturbances in GDP. We can clearly see that in the US GDP data. Each time we had a recession with GDP below 2%, we were at a solar maximum or minimum. The last solar maximum did not trigger anything in the US but did coincide with European and emerging-market crises. The last solar minimums coincided with the 2008 Financial Crisis and COVID.
While my work shows the risk/return is worse in declining solar phases, Belkin’s work implies it may not necessarily be the increasing or decreasing phases. Perhaps we can focus on excess risk at the solar cycle extremes.
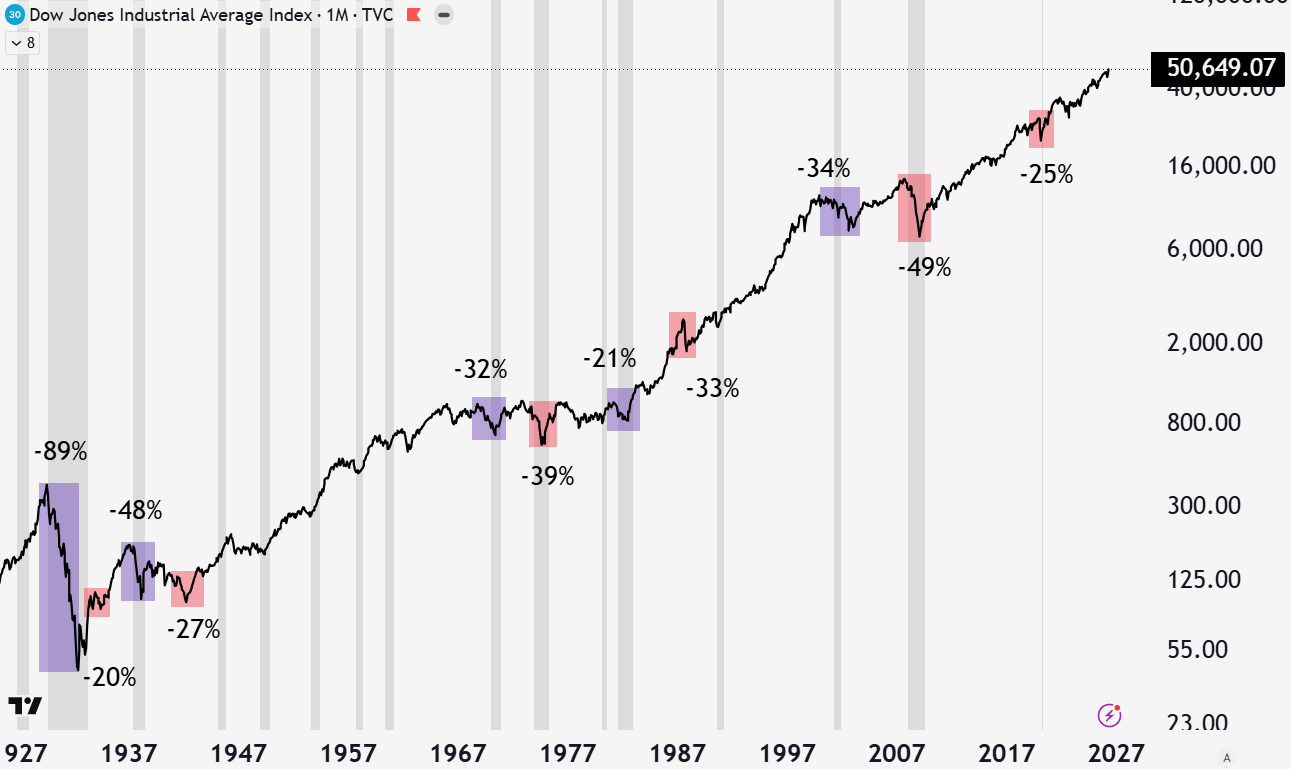
All of the worst drawdowns in the stock market also coincided with solar maximum or minimum. Solar maximum marked the top of the 1929 bubble and crash, and the second 1937 crash. It was also the top of the 1968 and 2000 bubbles. We are not out of the woods yet for the current environment to be a bubble top at solar maximum, similar to those times. If we continue without any struggles, it may be the 2030 solar minimum before the risk is high again, based on this analysis.
It is not a guarantee that solar extremes or declining solar activity cause recession and stock market correction. However, the connection is uncanny and significant. There are psychological and biological mechanisms that may show a causal link between the sunspot cycle and economic activity/stock market sentiment.
The first risk is the poor return/risk ratio during declining solar activity environments, which we just entered. The second risk is that recessions and major stock market declines cluster around sunspot cycle extremes. We are in the waning phase of solar maximum still.
Add on top of that the current stock valuation extremes during solar maximum, and you have historical analogues of 1929, 1968, and 2000. These all preceded lost decades for stock investors.
Dismiss this esoteric analysis if you must, but there are other economic and technical reasons why mainstream investments carry historic risk today that I have written about at The Gray Area. To learn how to overcome this excessive risk without destroying wealth, truly diversify, and still collect healthy returns, consider upgrading to a reasonably priced paid subscription.
-Grayson
Like to see these asymmetric opportunities synthesized into a real model portfolio that beats the S&P 500 and avoids major downside risks?
Socials
Twitter/X - @graysonhoteling
Email - thegrayarea55@gmail.com
Archive - The Gray Area
Notes - The Gray Area
Promotions
Sign up for TradingView
For educational and entertainment purposes only. The Gray Area should not be taken as financial advice.
There's a guy in Antelope Valley, CA, an amateur weather forecaster, who is claiming that the solar cycles drive climate change and anthropogenic emissions have little to do with it. I think he's politically lopsided and a little naive in ignoring evidence to the contrary so I give him lower credibility. However he does bring up some very good points about long term solar cycles and shows evidence of correlative data (personally I would add that data to the overall modeling not make it THE weather model). He does predict the current declining phase will bring very cold weather back to the US...we'll see. The sun is THE massive influence in life here so it makes sense that its own cycles are influential.
Considering solar cycle alignment with economic cycles is interesting and we can add it to Ray Dalio's assortment of historical economic cycles he has reaearched which all appear to be peaking right now as well (also the 'Fourth Turning' ideas). If these things are all coalescing at the same time we could be in for a doozy of a downturn. Weather/food production, if it's a severe enough phenomenon, is a factor that money printing and other tricks can't get around.
While I’m far from an expert in the climate models, I do get the sense that space weather (magnetic field, solar cycle) is a much bigger deal than the mainstream recognizes on the climate and things like ocean currents.
Plus, from my understanding el nino should bring wetter conditions to the southern us and warmer/drier to the northeast! Relevant to skiiers haha.
As far as the cycles go, totally agree. I’ve also been familiarizing myself with Michael Howell’s debt/liquidity cycle(nothing to do with solar cycles). Ironically this is a 5.5yr cycle, which perfectly fits into the 11yr solar cycle. I’m working on this connection as well.