

If you find this article interesting, click the like button for me! I would greatly appreciate it :)
The Story
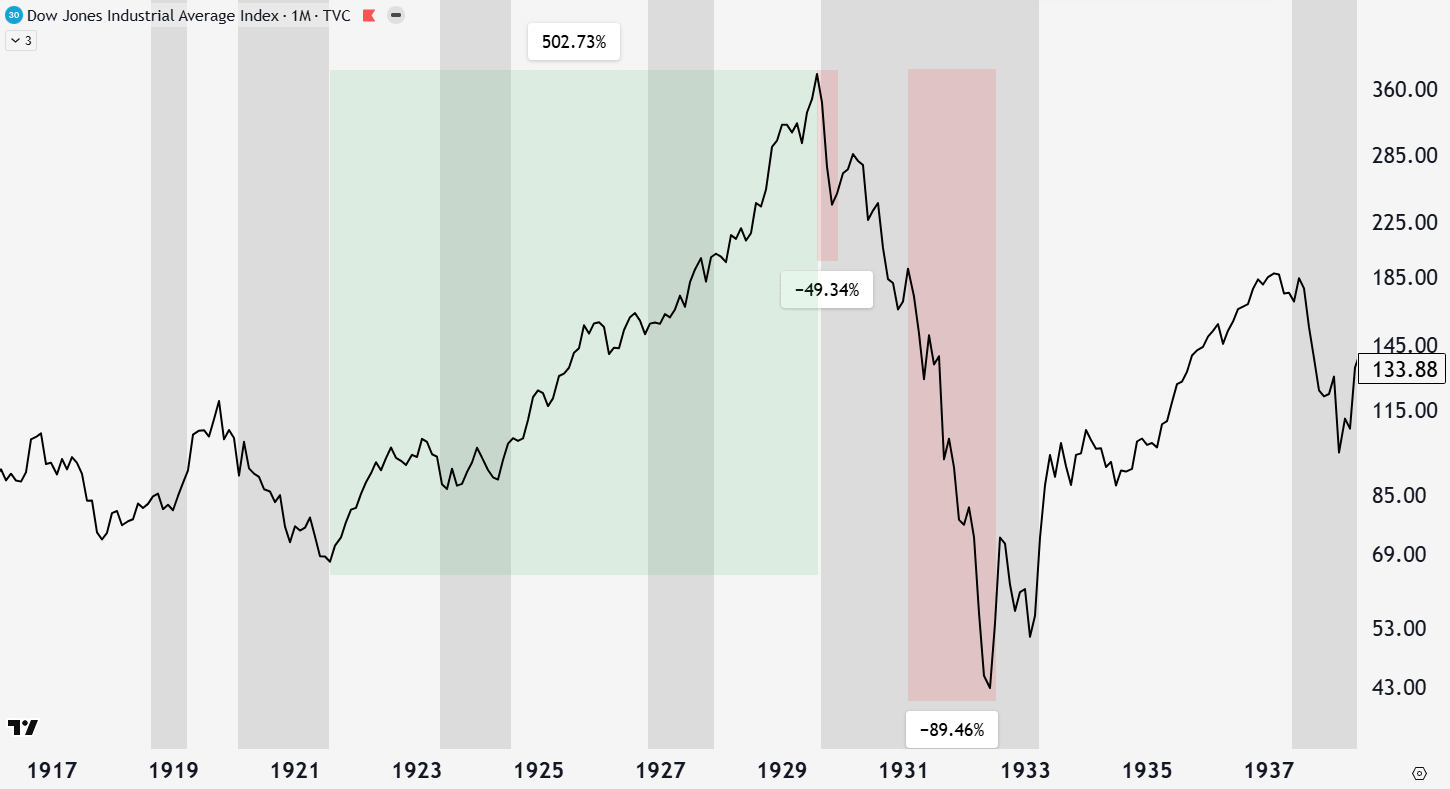
The Roaring Twenties were truly roaring, with the Dow Jones Industrial Average (DJI) returning 500% (25% compounded annual growth rate/CAGR) in just 8 years, from August 1921 to August 1929. Bubbles tend to have this “blow-off top” behavior that still somehow leaves investors greedy after all of those gains. The dot-com bubble grew 225% over 6 years (22% CAGR), and the current AI bubble grew 114% over the last 4 years (21% CAGR).
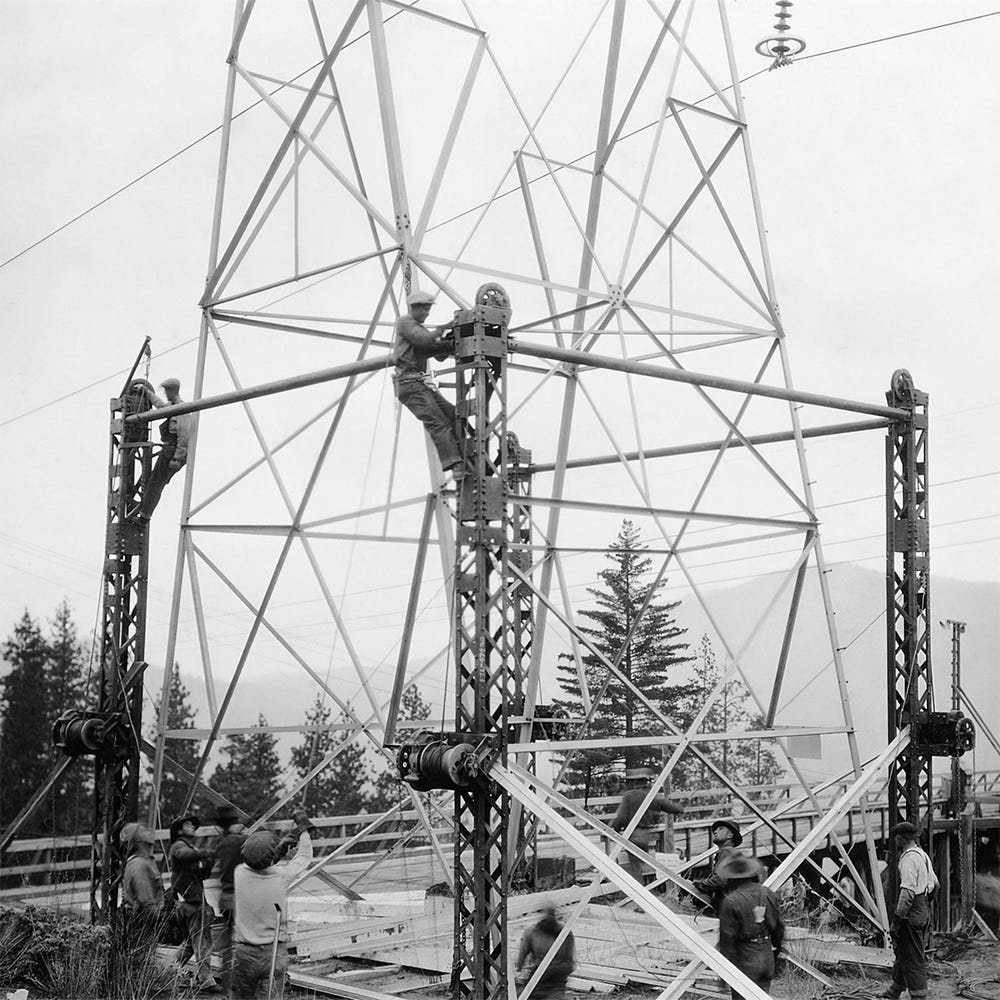
Bubbles always contain a story, and in the 1920s it was electricity. By the 1929 market crash, about 70% of American manufacturing relied on electricity, up from roughly 30 percent in 1914. The darlings of the time weren’t tech companies like today, but utilities that distributed that power helped fuel the late-1920s stock market boom. Last month I wrote about the British railway mania in Gone Pear Shaped, where the technology worked, but the investment didn’t. The electrification story had the same shape and feel as the railroads in the US and Britain.
With the invention of the light bulb, transformers, and transmission technology at the end of the 19th century, companies soon began devising ways to expand their reach. Power stations and transmission networks took off in the 1920s, especially as serving household demand became more feasible. Over the decade, electricity demand doubled, proving this was a technological revolution, not merely a psychological mania (like the 1630s Tulip Mania).
The Speculation
We know that electricity changed the world and kept growing, but we also know the decade ended with a 90% drop in the stock market. The financing mechanism is where the groundwork was laid.
Companies could obfuscate revenues across state lines to hide from regulation using holding companies. Holding companies would issue shares to purchase a utility company, and then another holding company would issue shares to buy the holding company with ownership of the utility. This pyramid structure caused many layers of separation and leverage between the final company and the operating business.
In the case that each layer funds itself with 40% equity and buys with 50% margin, the fourth holding company would get wiped out by a mere 1.3% decline in the underlying asset. At the peak, utility stocks traded at three times book value, meaning endless new capital and lack of regulation were required for things to continue.
Buyers showed up for years, with utility stocks making up 18% of the stock market, and rising twice as much as the rest of the market in 1929. Fraudsters (legal at the time) like Samuel Insull, through pyramiding and accounting tactics, were able to inflate reported operating income by at least 150 times.
A similar mania in the banking sector was happening simultaneously, driven by the expansion of bank branches not previously allowed and a subsequent acquisition frenzy. This fueled speculation in bank stocks as well as utilities.
The Bust
One thing you realize studying bubbles is that the crash doesn’t happen until there is a reason companies can no longer refinance their debt needs. There are many potential causes to blame for the bust, such as overbuilding of electrical capacity and a regulatory response. Companies like Insull’s needed new loans to cover costs and add new holding companies. Once financing becomes more difficult, with higher collateral commitments or higher debt servicing costs that can no longer be repaid, things get ugly. Add on top a selloff in the underlying asset, reducing collateral values. A spiral of harder-to-obtain commitments and lower asset values meant highly leveraged players got wiped out rather quickly.
In three months, the DJIA was down 48%. By the time the correction settled, the market was down 90%, with many investors wiped out with leverage. Regulation came in 1935, and the number of holding companies fell from 216 in 1938 to 18 in 1958. What boosted earnings and investor speculation on the way up also accelerated it on the way down.
Conclusion
Electricity demand kept growing, and the story about the electricity revolution was real, but that didn’t stop the leverage from being wiped out. The signs were there: opaque financing schemes, extreme market concentration, and inflation of earnings through financing schemes and accounting gimmicks. All of these are also present today with the AI bubble.
The AI theme now represents 49% of the stock market, surpassing every bubble since the 1870s railroads. The realization that, like all capital cycles, compute is outpacing demand is starting to kick in. Earnings of AI companies are overstated. On top of that, investor margin is at record levels.
Hyperscaler cash flow is now inadequate to fund AI investments, and they are turning to bond issuance. The massive supply of investment-grade debt has to compete with longer-term government bonds for capital. Along with investor concerns (risk premia), this is the reason interest rates are going higher, not inflation. This is proven empirically by the bond market’s inflation forecast (breakeven inflation rate remaining stable).
Off-balance-sheet vehicles, lease commitments, GPU asset-collateralized loans, circular financing, and equity financing all blur the financing risk. This risk is starting to appear, as Oracle’s credit default swaps (default insurance) are exploding, CoreWeave's bonds are now trading at 15%, and Anthropic’s latest financing is up from 7% four months ago to 10%, in junk bond territory. Yields are determined by supply and demand, which shows that investor demand for these investments is waning and a higher return is demanded for the risk.
Where this financing becomes problematic is the refinancing. When a company fails to cover the collateral requirements to obtain a loan or when the financing terms cause the company to fail to meet future debt obligations is when the crash will happen. When investors get spooked, the loss of asset value will ripple through the leverage and accelerate the downfall.
There is a real AI technology with a surge in investment to follow, just like the electrification and railroad booms. That doesn’t mean that the investments can’t get wiped out like it was in 1929. We are at the phase where the investments are taking place, but are getting more expensive. Soon these expenses will take enough of a toll for someone to crack.
Please don’t sleepwalk into a market disaster and forget about market risk at the exact worst time. Upgrade to see The Gray Area Model Portfolio to learn how to manage these exact risks. We cover exactly where I think the market is headed in the short and long term, key risk management parameters, position entry conditions, REAL diversification principles, and more. We are beating the market nominally with way less risk, so check it out by clicking here.
Until next time,
-Grayson
Like to see these asymmetric opportunities synthesized into a real model portfolio that beats the S&P 500 and avoids major downside risks?
Socials
Twitter/X - @graysonhoteling
Email - thegrayarea55@gmail.com
Archive - The Gray Area
Notes - The Gray Area
Promotions
Sign up for TradingView
For educational and entertainment purposes only. The Gray Area should not be taken as financial advice.