🔋Time To Concentrate
Seven stocks blew the S&P 500 out of the water in 2024, but market concentration may not be the strength you're looking for.
If you found this article interesting, click the like button for me! I would greatly appreciate it :)
Stock market valuations are nothing but sentiment. If you don’t believe me, check out this chart showing the consumer confidence index in blue and the CAPE/Shiller P/E ratio of the S&P500 in red. The cyclically adjusted price to earnings (CAPE) ratio is a valuation measure that takes the stock price divided by the real company earnings per share over the last 10 years. Simply put, it shows how much people are willing to pay for a stock relative to the company’s underlying earnings. Along with the buffet indicator, these metrics provide information about how expensive stocks are relative to history. The consumer confidence index like the one the conference board releases is an index of data that gauges consumer behavior, expectations, and sentiment.
While the exact values and change don’t perfectly match, the directions in these data sets align almost perfectly. When consumer confidence increases or stays flat, so do stock market valuations. When consumers are fearful and confidence declines, so do stock market valuations. When people are feeling good about their economic situation, they are much more willing to bid up stocks to higher and higher levels.

When it comes to stocks in particular, consumers have rarely (if ever) been as confident as they are right now. After the market bottomed in October 2022, confidence has returned in full force and consumers have incredible confidence for stocks in 2025.
One issue with the market returns over the last few years is they have been driven by fewer and fewer companies. A healthy market is typically characterized by a broad basket of stocks all performing well over a multi-year period. While this technically is the case, the top stocks have performed significantly better. One way to show this is the S&P 500 which is market-cap weighted vs the equal weight index. The equal cap gives comparatively more weight to the smaller companies in the index and shows a clear underperformance.
Another way to show this is the “Mag-7” or top 7 market cap stocks vs the S&P 500 and the Russel 2000 (small market cap companies). If you only had money in the top 7 stocks last year you would have more than doubled the return of the S&P500. Your financial advisor is not allowed to invest this way for you and even if he could they may tell you it is more prudent to diversify. Even going back 4 years to 2021 you could have bought these 7 companies and returned 104% instead of 62%. Regardless, this is extreme market concentration that is not historically normal.
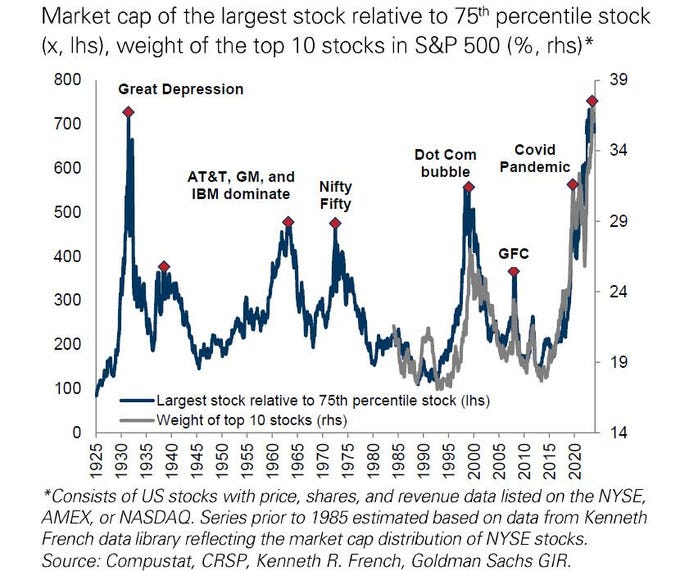
To really ram home the point about stock market concentration, the market has never been more concentrated on the following metric. The market cap of the largest stock to the 75th percentile stock goes back to 1925 and has never been higher than today. This tracks closely with the weight of the top 10 stocks which also has never been higher but only goes back to 1985. Market concentration is yet another indicator that rears its head at bubble extremes. The great depression, early tech giants, nifty fifty, and the dot com bubble were not times to to two feet first into the market and we are higher than every one of those on this metric.
This all connects back to a few articles I wrote about the passive investing trend which has been taking over markets at an accelerating rate [1,2,3,4]. Stock market valuations are being decoupled from earnings in part due to these passive flows boosting the valuations and exacerbated by stock buybacks. The higher the passive share of the market (currently 40%), the higher valuations get exponentially according to asset manager Mike Green. Recently he shared a chart on X that shows the correlation between the S&P500 market weight and equal weight. The increase in passive investing correlates with the breakdown in correlation between these two stock indices and hence the drastic outperformance of the very top companies.
All this is to say the market is very concentrated. It is even noteworthy that the market valuations while directionally accurate have remained elevated despite the consumer confidence deteriorating very significantly. I have said that the market may yet go higher in the short term because of low credit spreads, resilient US GDP, and of course these passive flows and buybacks that create a continuous bid higher for these “Mag 7” stocks. However, be warned of the tremendous risk that this has caused the market historically. In addition to the other pre-recession signals, it is a time to remain vigilant with your investments and employment situations. Until next week,
-Grayson
Leave a like and let me know what you think!
If you haven’t already, follow me at TwitterX @graysonhoteling and check out my latest post on notes.
Socials
Twitter/X - @graysonhoteling
LinkedIn - Grayson Hoteling
Archive - The Gray Area
Let someone know about The Gray Area and spread the word!
Thanks for reading The Gray Area! Subscribe for free to receive new posts and support my work.


