

If you find this article interesting, click the like button for me! I would greatly appreciate it :)
The model portfolio was made public in July 2025. It has 5 main components: stocks, bonds, cash, real assets, and alternative assets. Last month’s performance has been:
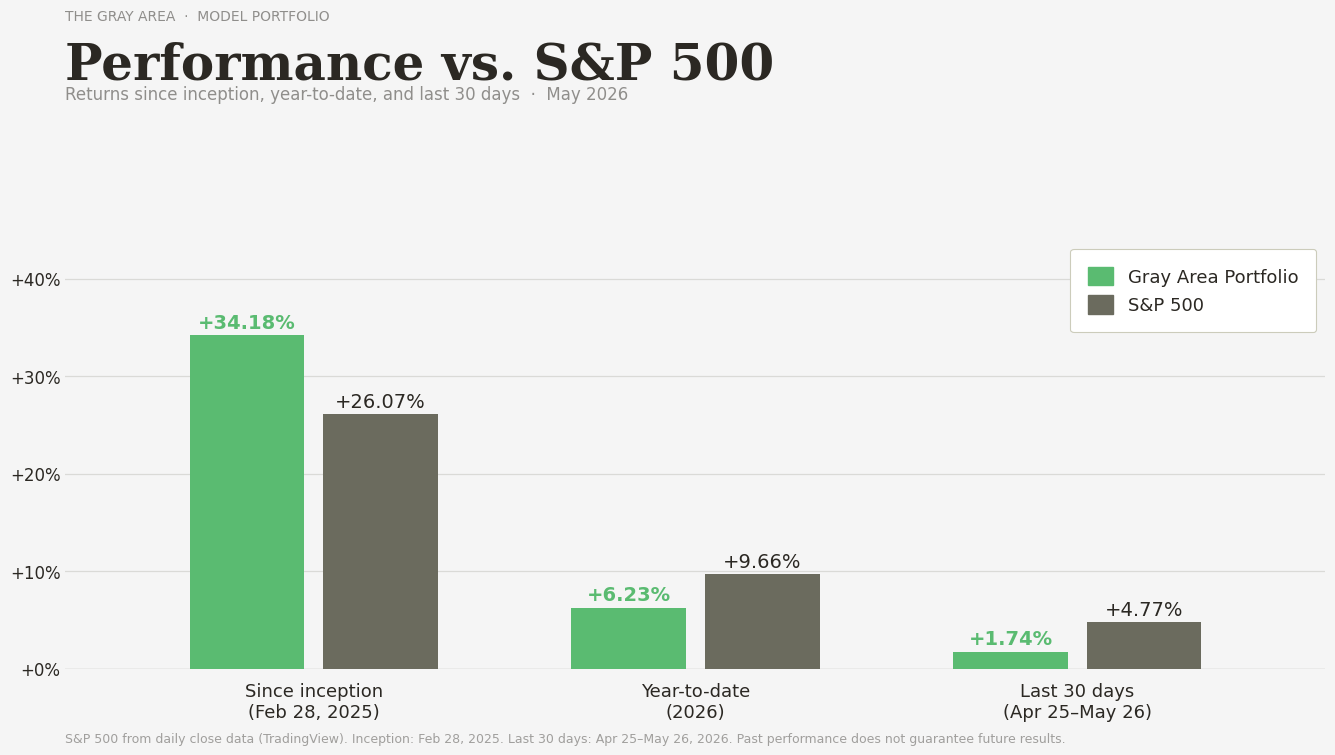
The market has been on an all timer since March 31st (+17.55%), indicative of the bubble/speculative nature of the current stock market. This is supported by some technical datapoints I discussed last week in Thin Ice.
It is dangerous to get caught up in the FOMO (fear of missing out), as these market returns and dynamics are clustered around bubbles/manias. The Gray Area portfolio outperformed the struggling market in the first quarter and is up a healthy 6.23% year to date with lower risk.
This model portfolio is reasonably priced for paid members, with free subscribers still receiving three themed research articles each month. Consider upgrading to get up-to-date portfolio changes, allocation decisions, technical analysis, and synthesis of all the research pieces into an actionable plan. To beat the market, reduce risk, and know how to not get destroyed in a bear market, please consider joining with a premium subscription.
I will continue to provide a preview of two of the positions in the portfolio.
Natural Gas Companies (FCG) - 5.7%
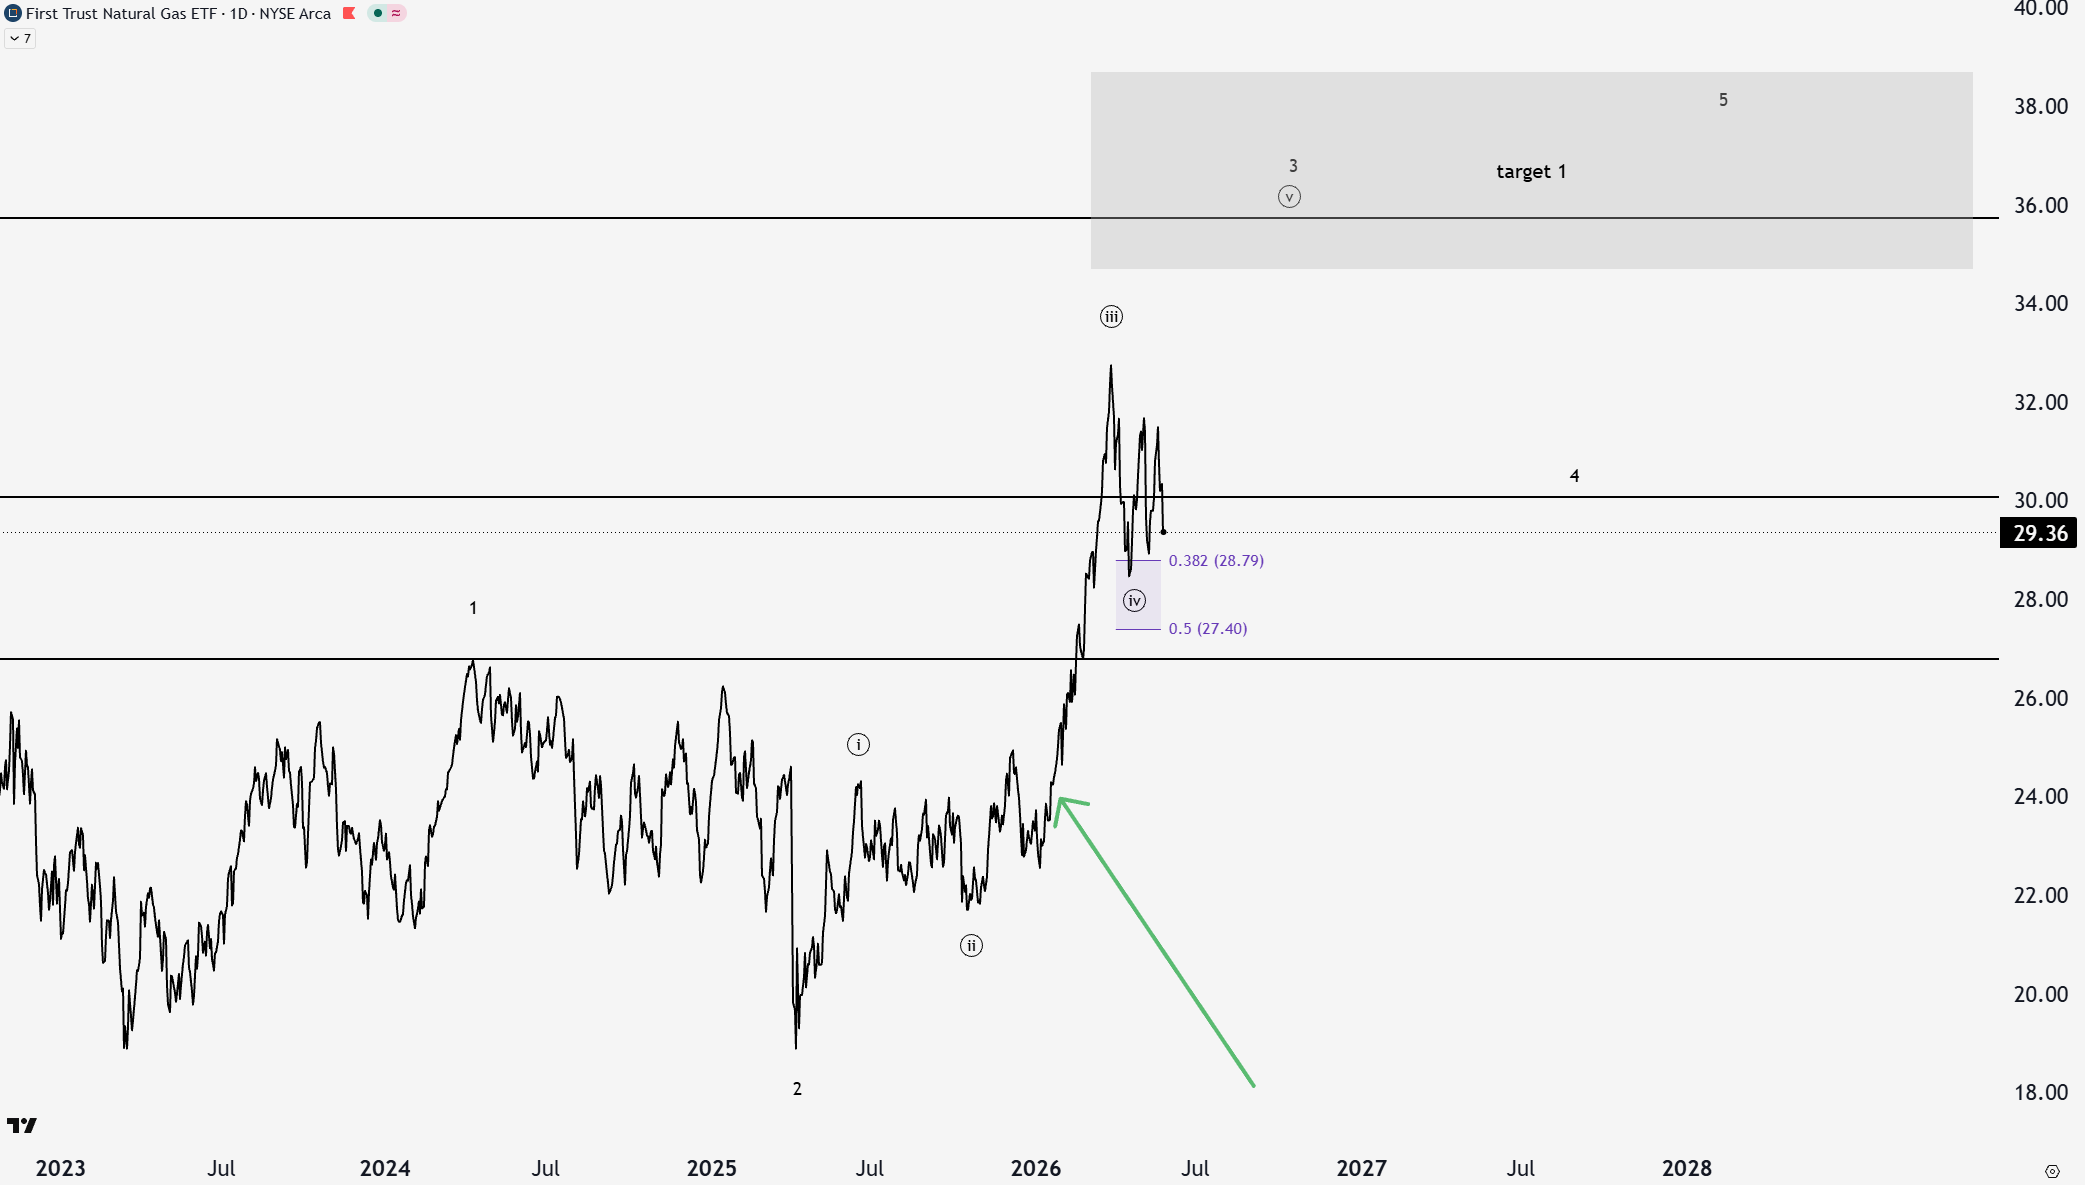
The Iran conflict started on February 28th. I spotted this promising setup in oil/gas in my article No Love, on February 2nd, around the time it was added to the portfolio (green arrow).
This shows the power of technical analysis and key levels. The news doesn’t matter beyond being a catalyst for volatility (e.g., a good earnings report → stock down). This happened just last week, with another incredible NVIDIA earnings report.
I obviously didn’t know that oil going through the Strait of Hormuz would be blocked, sending crude and LNG prices higher. That’s the narrative, but FCG went up 20% before the conflict even happened.
This portfolio position is up 20.17% total. It broke through the resistance level at $30 to finish circle wave iii. It bounced off the perfect circle wave iv support. The target box/take profit zone for this move is +20% at $35, with Fibonacci levels and past price resistance in that area. If FCG is going to really push in the long term, $60s is the upper target.
Uranium Miners (URNM) - 4.5%
The allocation to real assets like uranium metal and uranium mining companies provides real diversification, not just alternative sectors to stocks. Real assets will help provide inflation protection as well as diversify into a less globalized world.
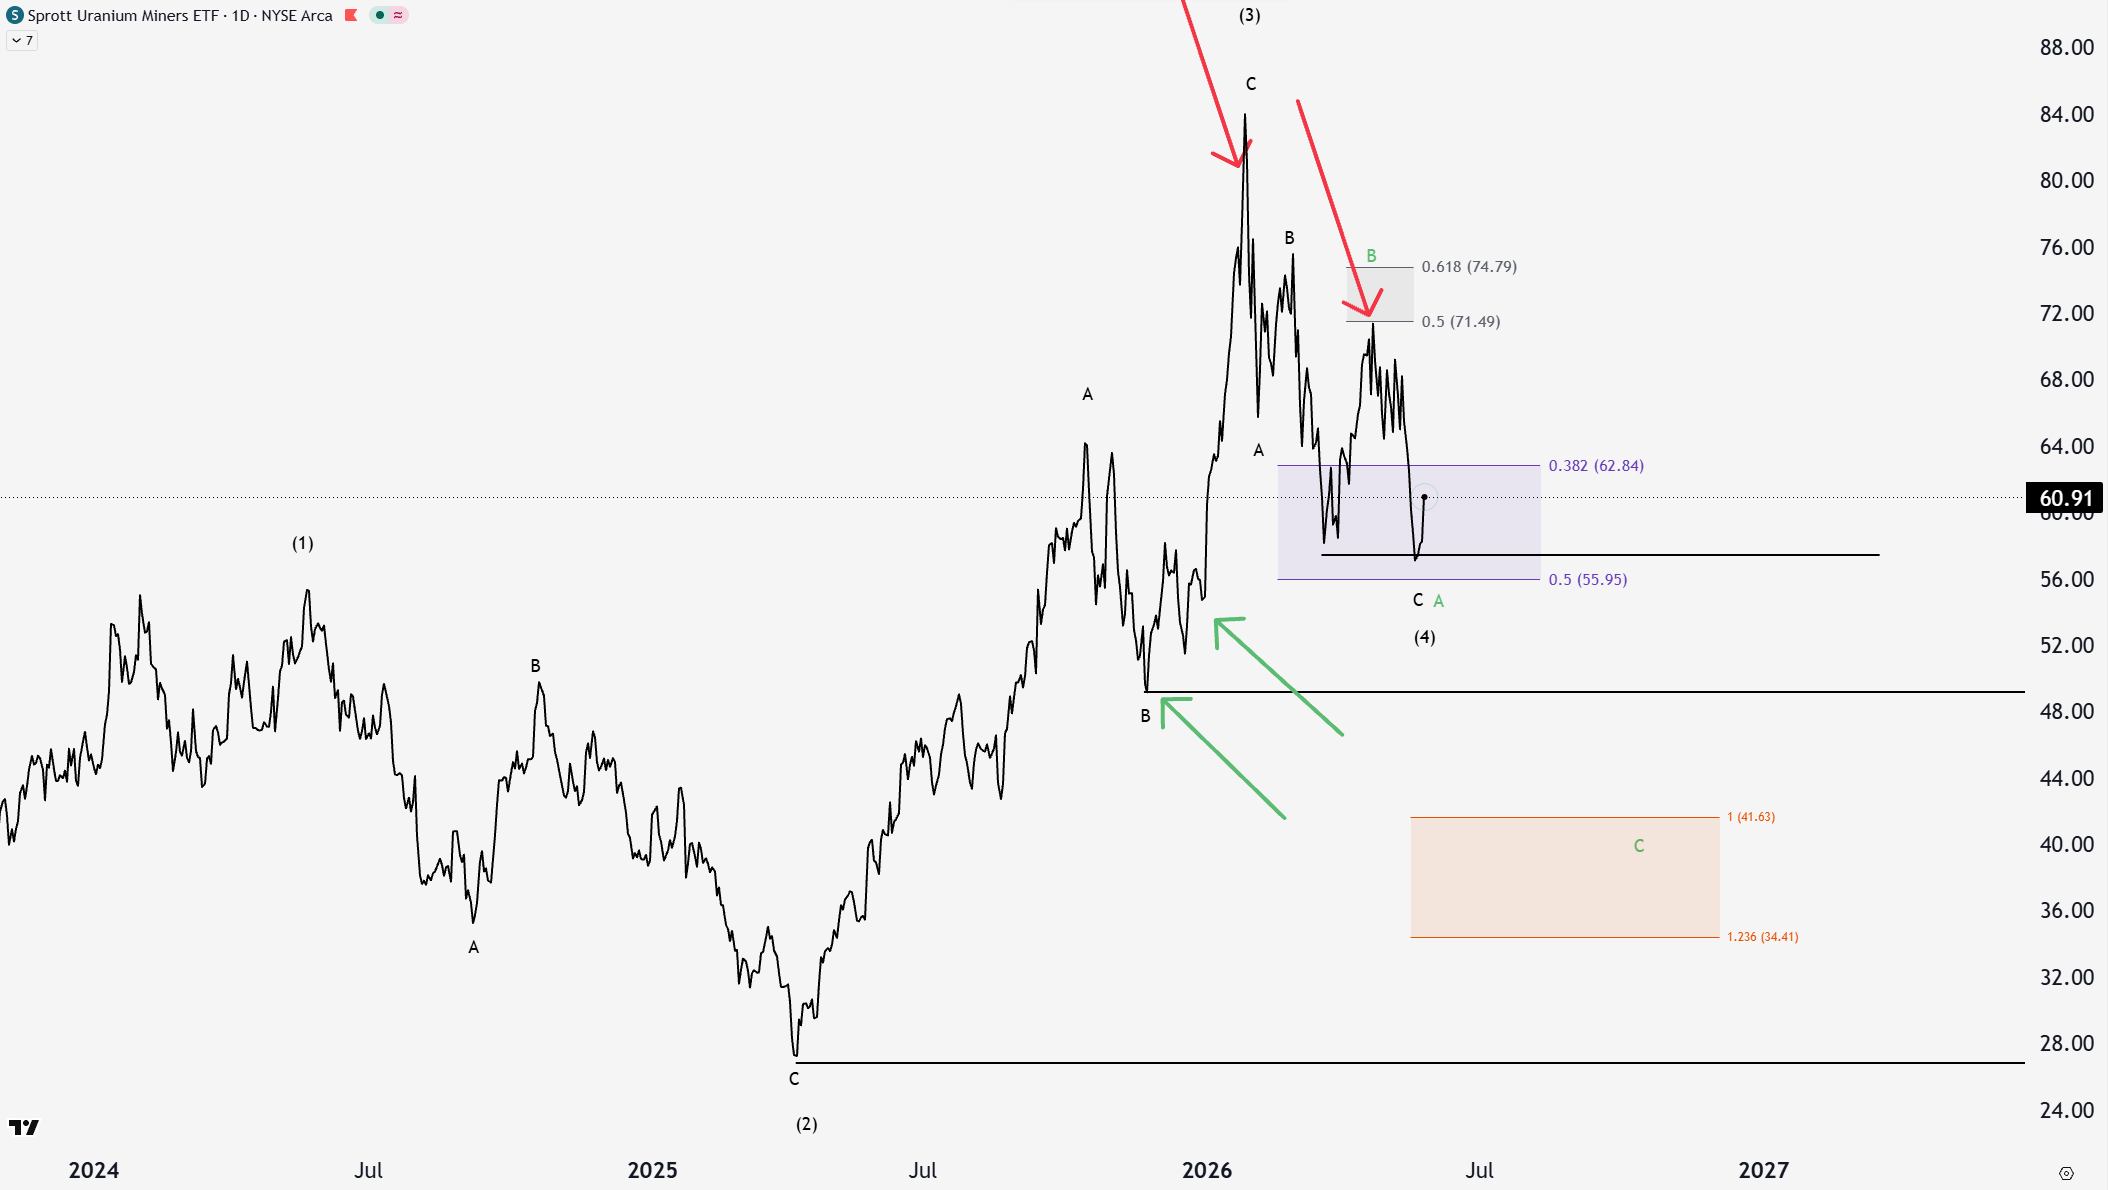
Uranium prices have been moving similarly to precious metals. The pullback has made our reduction last month even more prescient. Many people are getting bullish on precious metals again, but alongside uranium, I see a choppy, low-confidence structure. We are still allocated for the longer timeframe, but I wouldn’t be at all surprised to see another sharp selloff into the orange box around $40 in the green ABC pattern.
For the full portfolio breakdown and analysis, please upgrade your subscription.