

If you find this article interesting, click the like button for me! I would greatly appreciate it :)
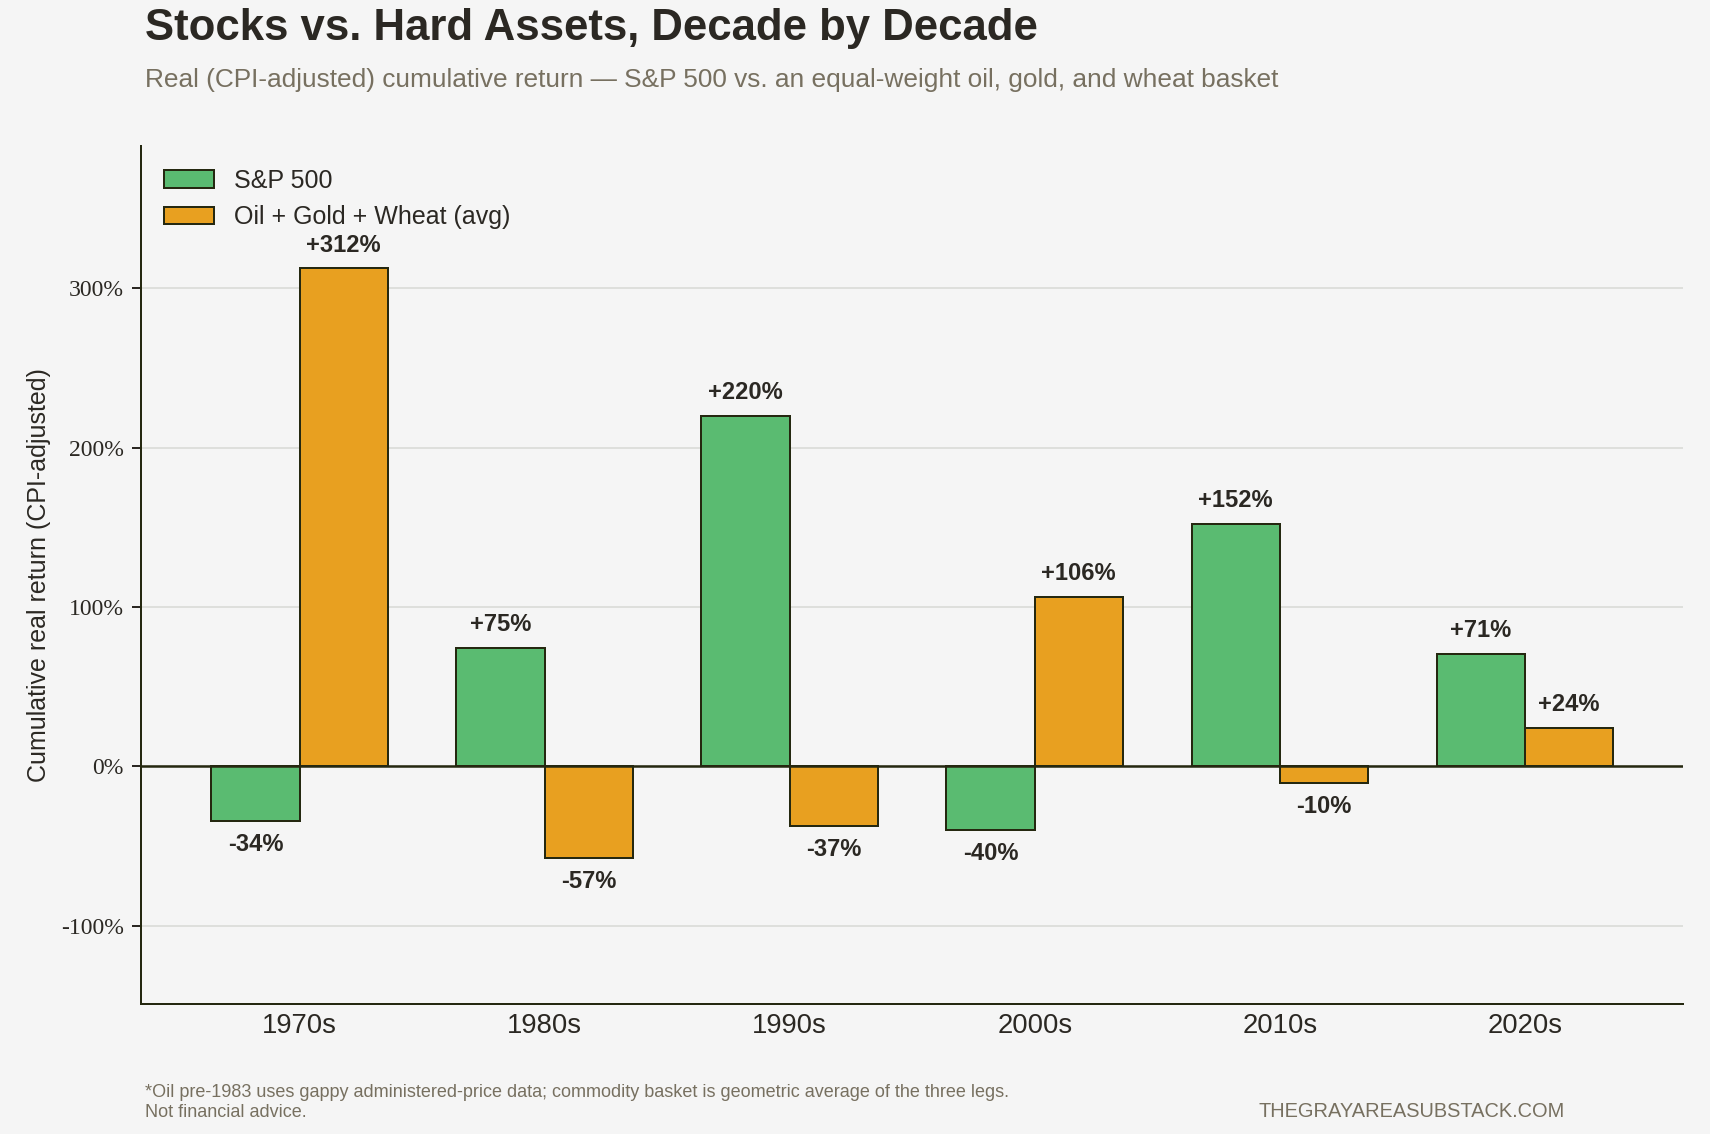
Would you rather own the best stocks in the world or commodities? The answer is likely, and rightfully, an enthusiastic vote for stocks. Stocks generate earnings and grow capital over time. Commodities are merely dug up and consumed year after year, are volatile, and often perform negatively for multiple decades at a time. This axiom of investing is severely challenged during lost decades in the stock market. The 1930s, 1970s, and 2000s were lost decades which saw negative real returns for stocks. Where were the real returns over these time frames? You guessed it, commodities.
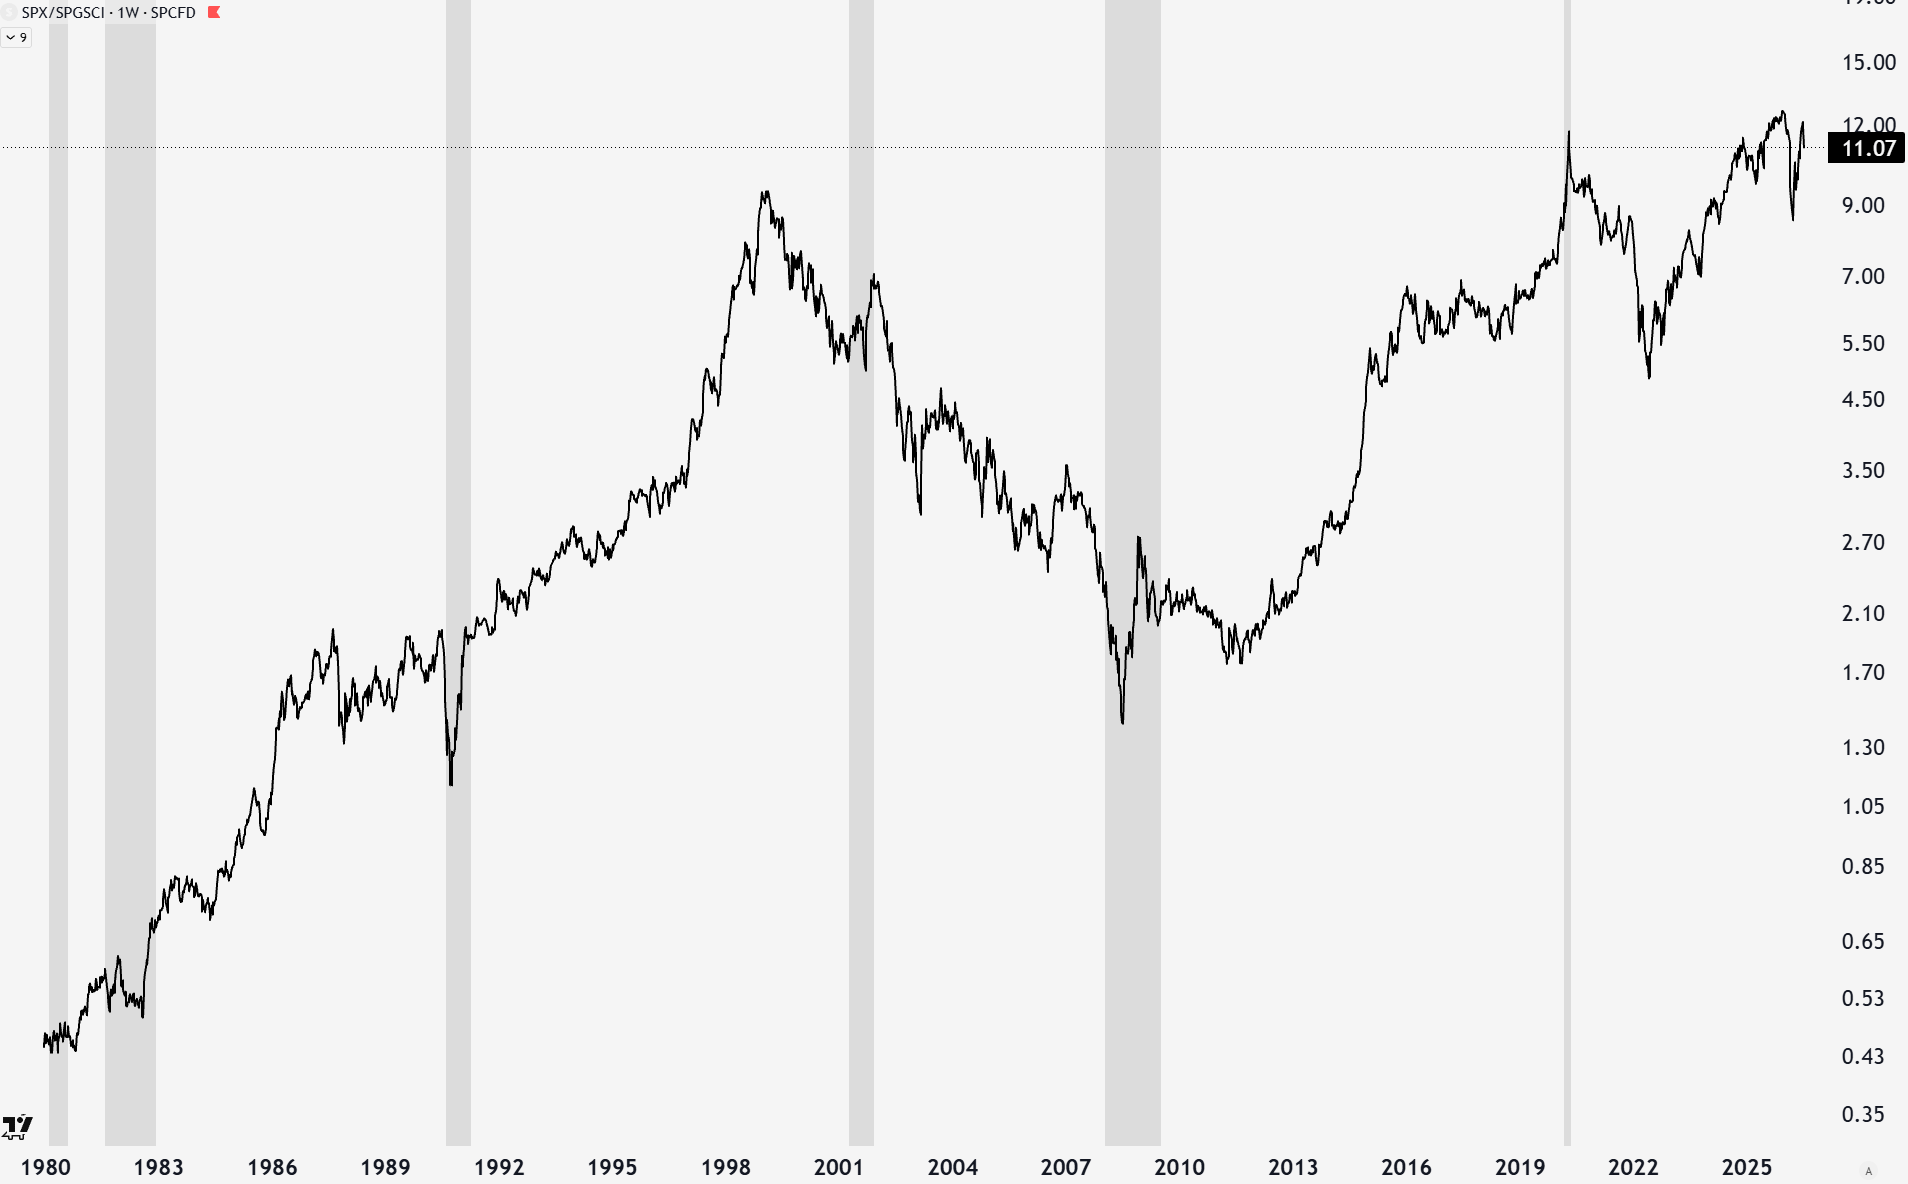
The ratio of stocks to commodities shown below captures the relative performance. It will suffice for showing this ratio, but SPGSCI is not a perfect basket of commodities, with a composition of 51% energy, 17% agriculture, 12% industrial metals, 11% livestock, and 8% precious metals. The stock-to-commodity ratio is currently higher than it was at the dot-com bubble peak. You can also clearly see the extreme underperformance from 2000 to 2010.
Stocks
How do we know if we should be thinking about a lost decade for stocks and should be switching to commodities? The first thing to do is to get a general sense of stock market valuation, as the late 1960s and late 1990s were characterized by stock market bubbles. This is the first clue that forward returns for stocks would not live up to expectations. Today, we are undoubtedly in an AI bubble. Today is worse than people realize because the bubble isn’t directly in the investor valuations, but in earnings. This makes the forward price-to-earnings valuation metrics look totally normal and trick investors into thinking everything is fine.
We can also look at economic data to suggest whether we are going to get strong growth going forward. The economy is not rolling over, but for multiple reasons, as I’ve written, the economy is in a dangerous, pre-recessionary environment. Some of these data points include liquidity, full-time employment, yield curves, net savings, and leading economic indicators.
I’ve been warning, to mixed success, about this relationship for two years. In The Bear And Some Rocks, I identified this exact trend and outlined oil, sugar, copper, and gold. Since then, oil is flat, sugar down 25%, copper up 40%, and gold up 73%. The S&P 500 is up 49% in just over two years since then, meaning the lost decade has not started. This is not unexpected, though, as I ended the piece,
While these are long-term views, anything can happen in the short term. It is possible to have a recession that brings down commodity prices further as well as another blow-off top in the stock market before the core themes I’ve described become self-evident.
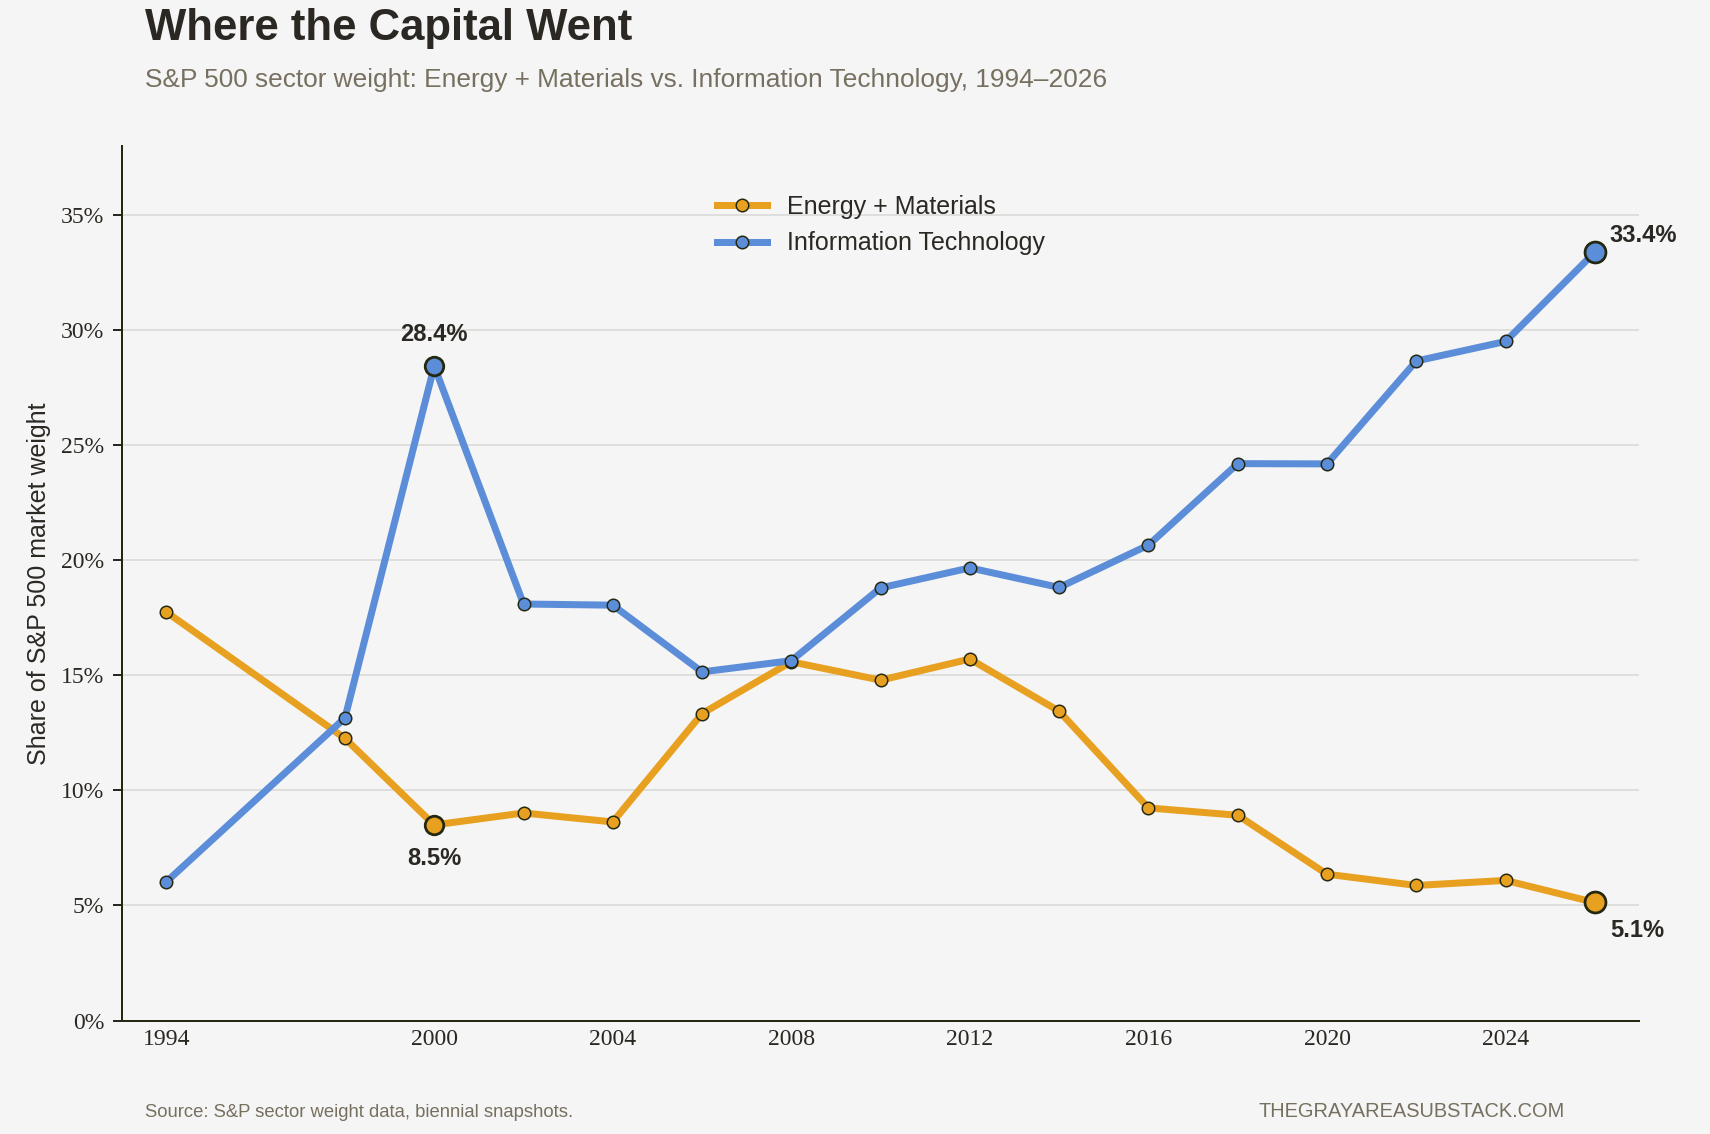
The blow-off top ended up the path we are on, with back-to-back >20% return years for the S&P500 and momentum still on its side. Today is even more extreme than the dot-com bubble from a relative price chart, some valuation extremes, and index weightings. It seems normal that technology takes up more market cap in the S&P 500, but this hasn’t always been the case. The divergence was extreme in the dot-com bubble, reverted, and now has grown to more extreme deviations. Energy and materials make up a meager 5%, while tech makes up 33% (semiconductors 18%).
Enough about stocks; we also have to have an idea of whether commodities will be a good replacement for stocks if they underperform once this bubble rolls over.
Real Assets
The capital cycle causes booms/busts in major bubbles like railroads, internet, shale gas boom, and soon to be AI. Bubbles burst when the oversupply is so large it causes a glut, which naturally brings prices down.
Commodities are the most sensitive sector to capital cycles. This means that underinvestment in the sector causes supply shortages, which eventually cause shortages and wild swings higher in prices. Oil is a key example. While oil can be brought online quickly in some regions, it does typically take significant investment to obtain future oil.
The rig count divided by oil production shows us that we are at low levels of oil investment relative to the amount of oil being produced. While this can be partially attributed to efficiency improvements, it shows that oil producers are not choosing to invest in new infrastructure and are merely tapping existing wells to produce oil. To get the full picture on oil, you have to read Oh Barnacles! This low investment was also seen before oil destroyed stocks in the 2000s.
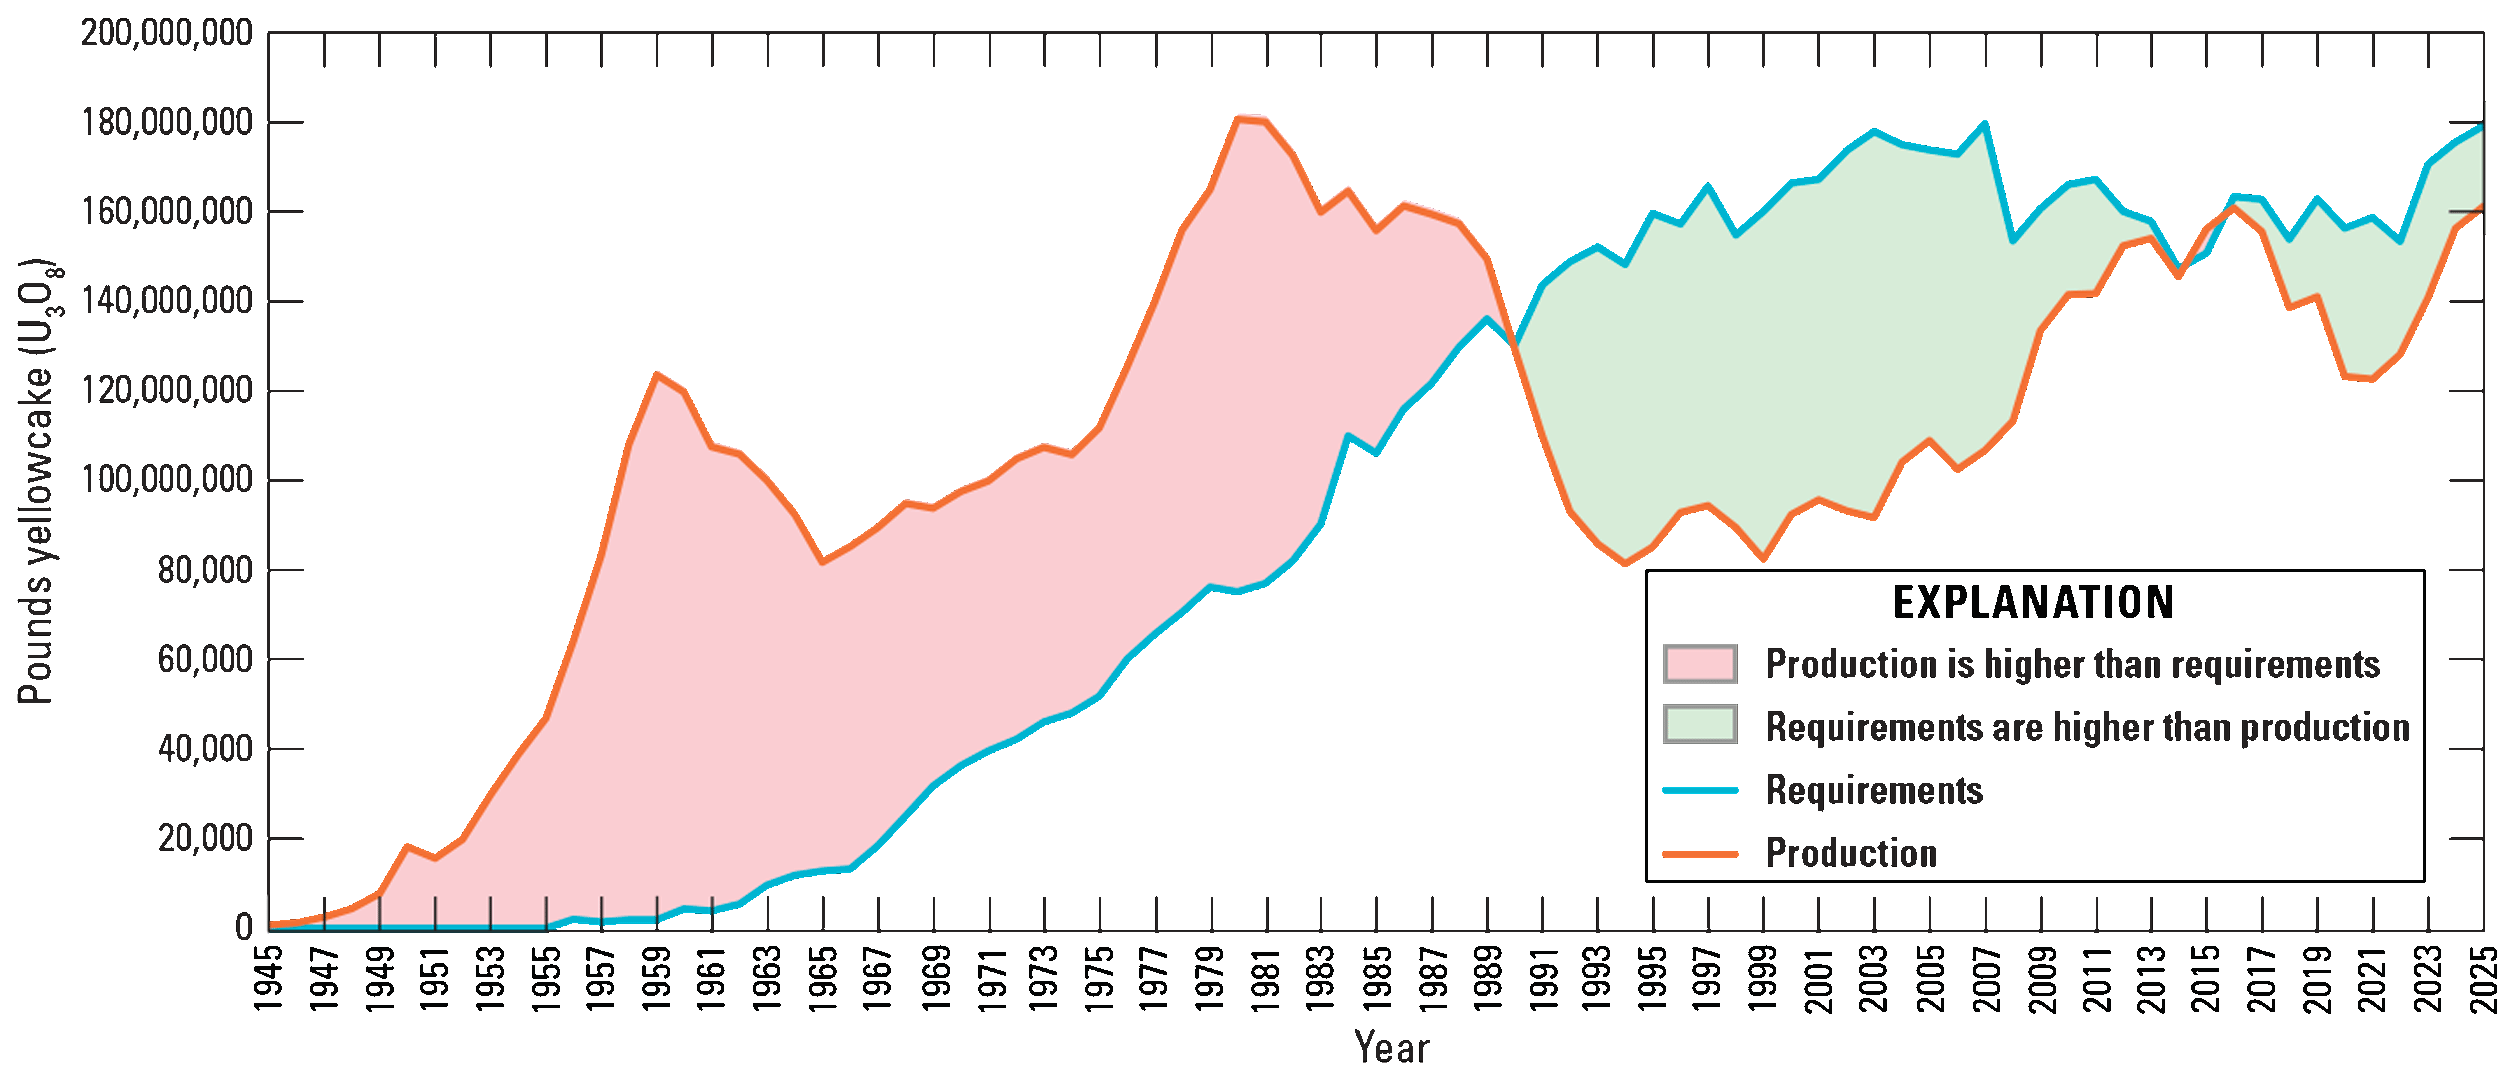
Mining companies have much longer capital cycles than oil. Instead of 3-10 years, mining stocks are 10-20 years. This means that over/under supply can get much worse before the response to the problem is realized. Uranium sits at the intersection of energy and mining markets. Uranium must be mined with long capital cycles and is currently at a deficit to nuclear reactor production requirements. Add on future clean energy demands, the renaissance of nuclear energy popularity, and Kazatomprom struggling with production, you have a recipe for uranium deficit.
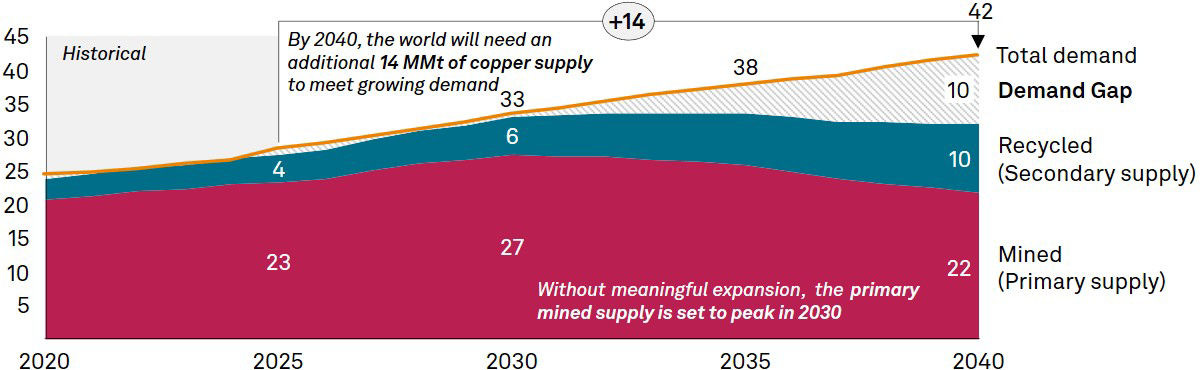
Industrial metals like copper also sit at the far end of the spectrum with long capital cycles. There is a decade or more lead time for a new copper mine to come online. S&P Global has projected that copper supply is soon to be in a deficit to demand. Goehring & Rozencwajg suggest that this is not the case since China has pulled forward a lot of copper demand, leaving the future situation not as bad as projected. I’ll add on a projection that the data center buildout will not continue as aggressively as currently projected. Further, Copper is known as Dr. Copper and is tied to the growth of the economy. If these contrarian views materialize, copper will not do quite as well.
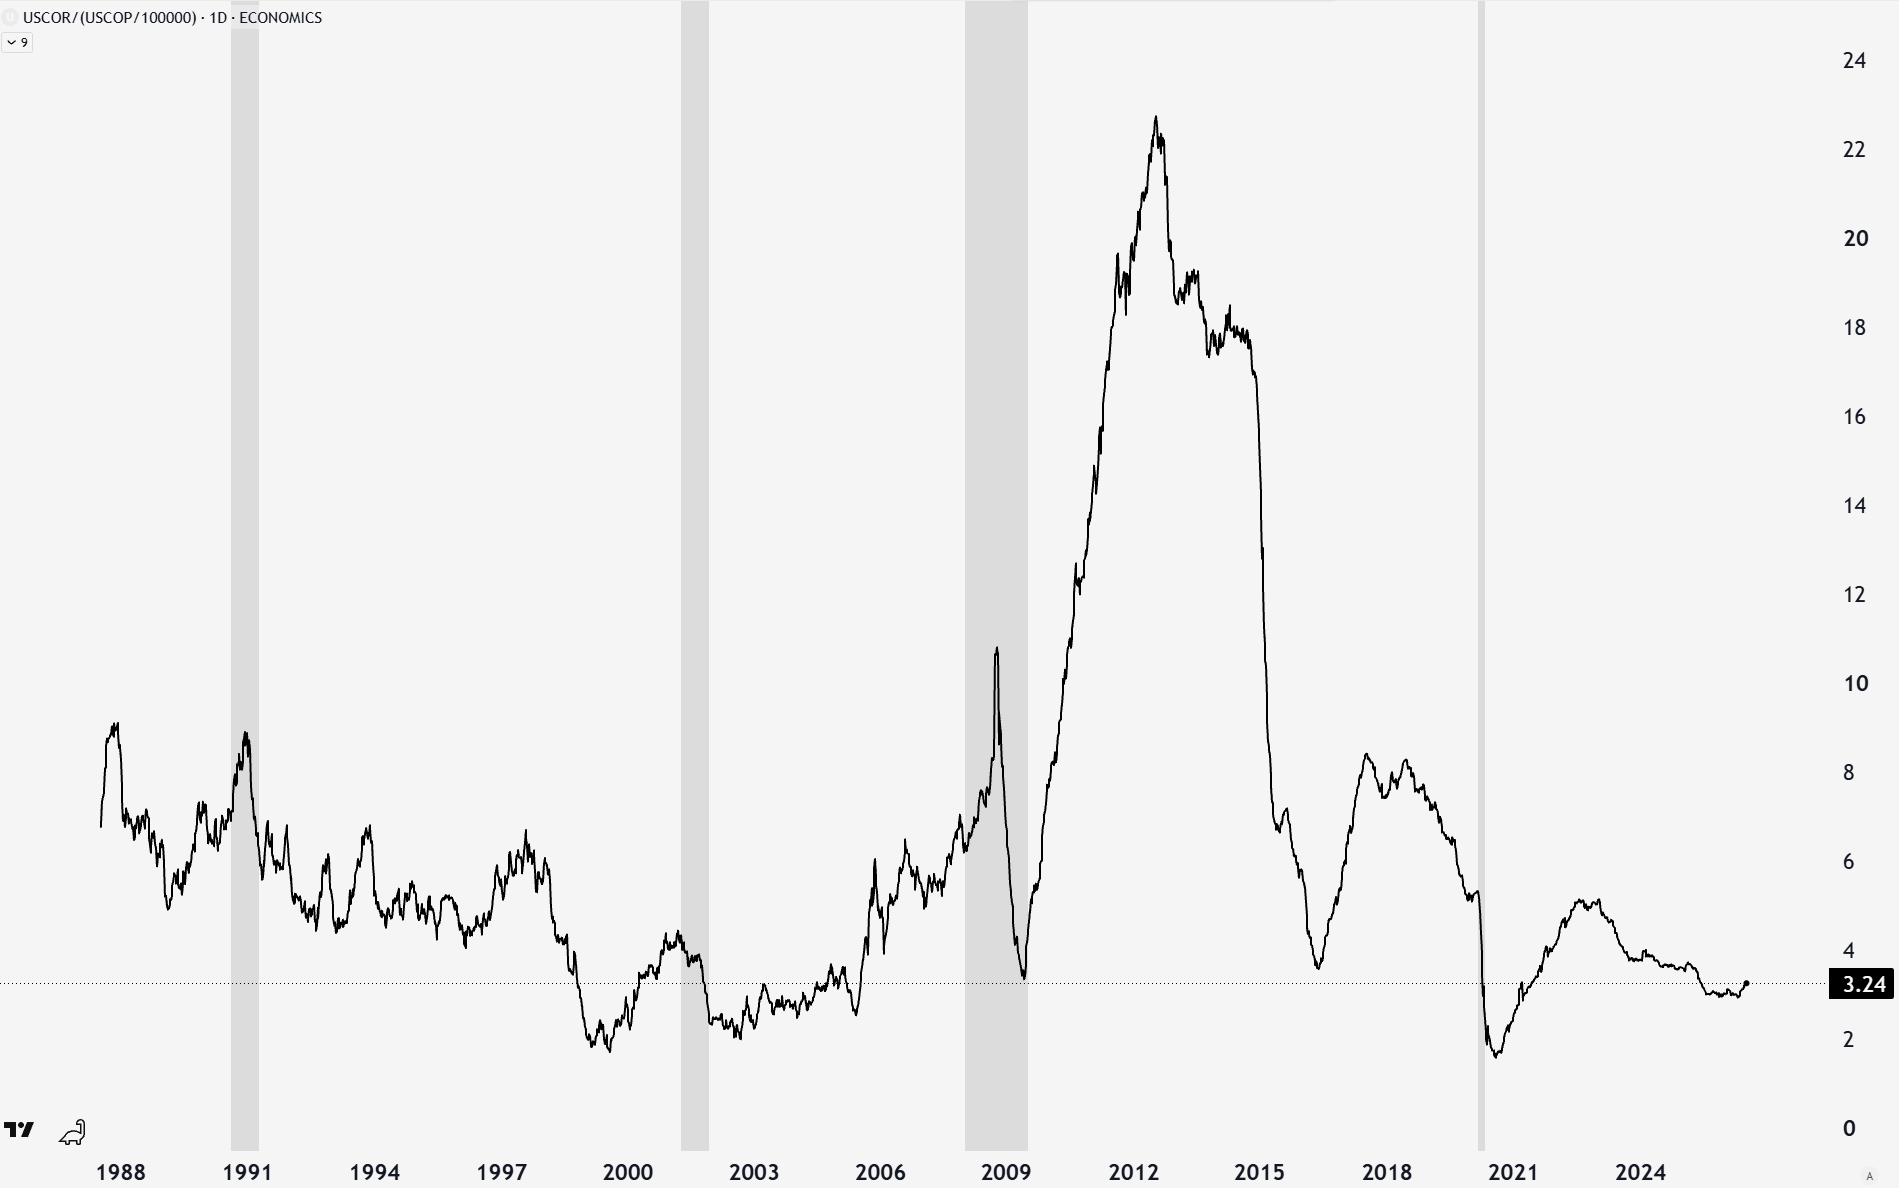
Agriculture has very short capital cycles, as immediate next-year production responses are normally possible. Capital cycles are not the dominant driver of agricultural price volatility. Supply issues are more commonly brought on by geopolitical and weather-related supply shocks in export-heavy countries.
Russian wheat production or Middle East fertilizer have the potential for geopolitical impacts. The looming strong El Niño could affect crop supplies in areas like South and Southeast Asia, Australia, and South America.
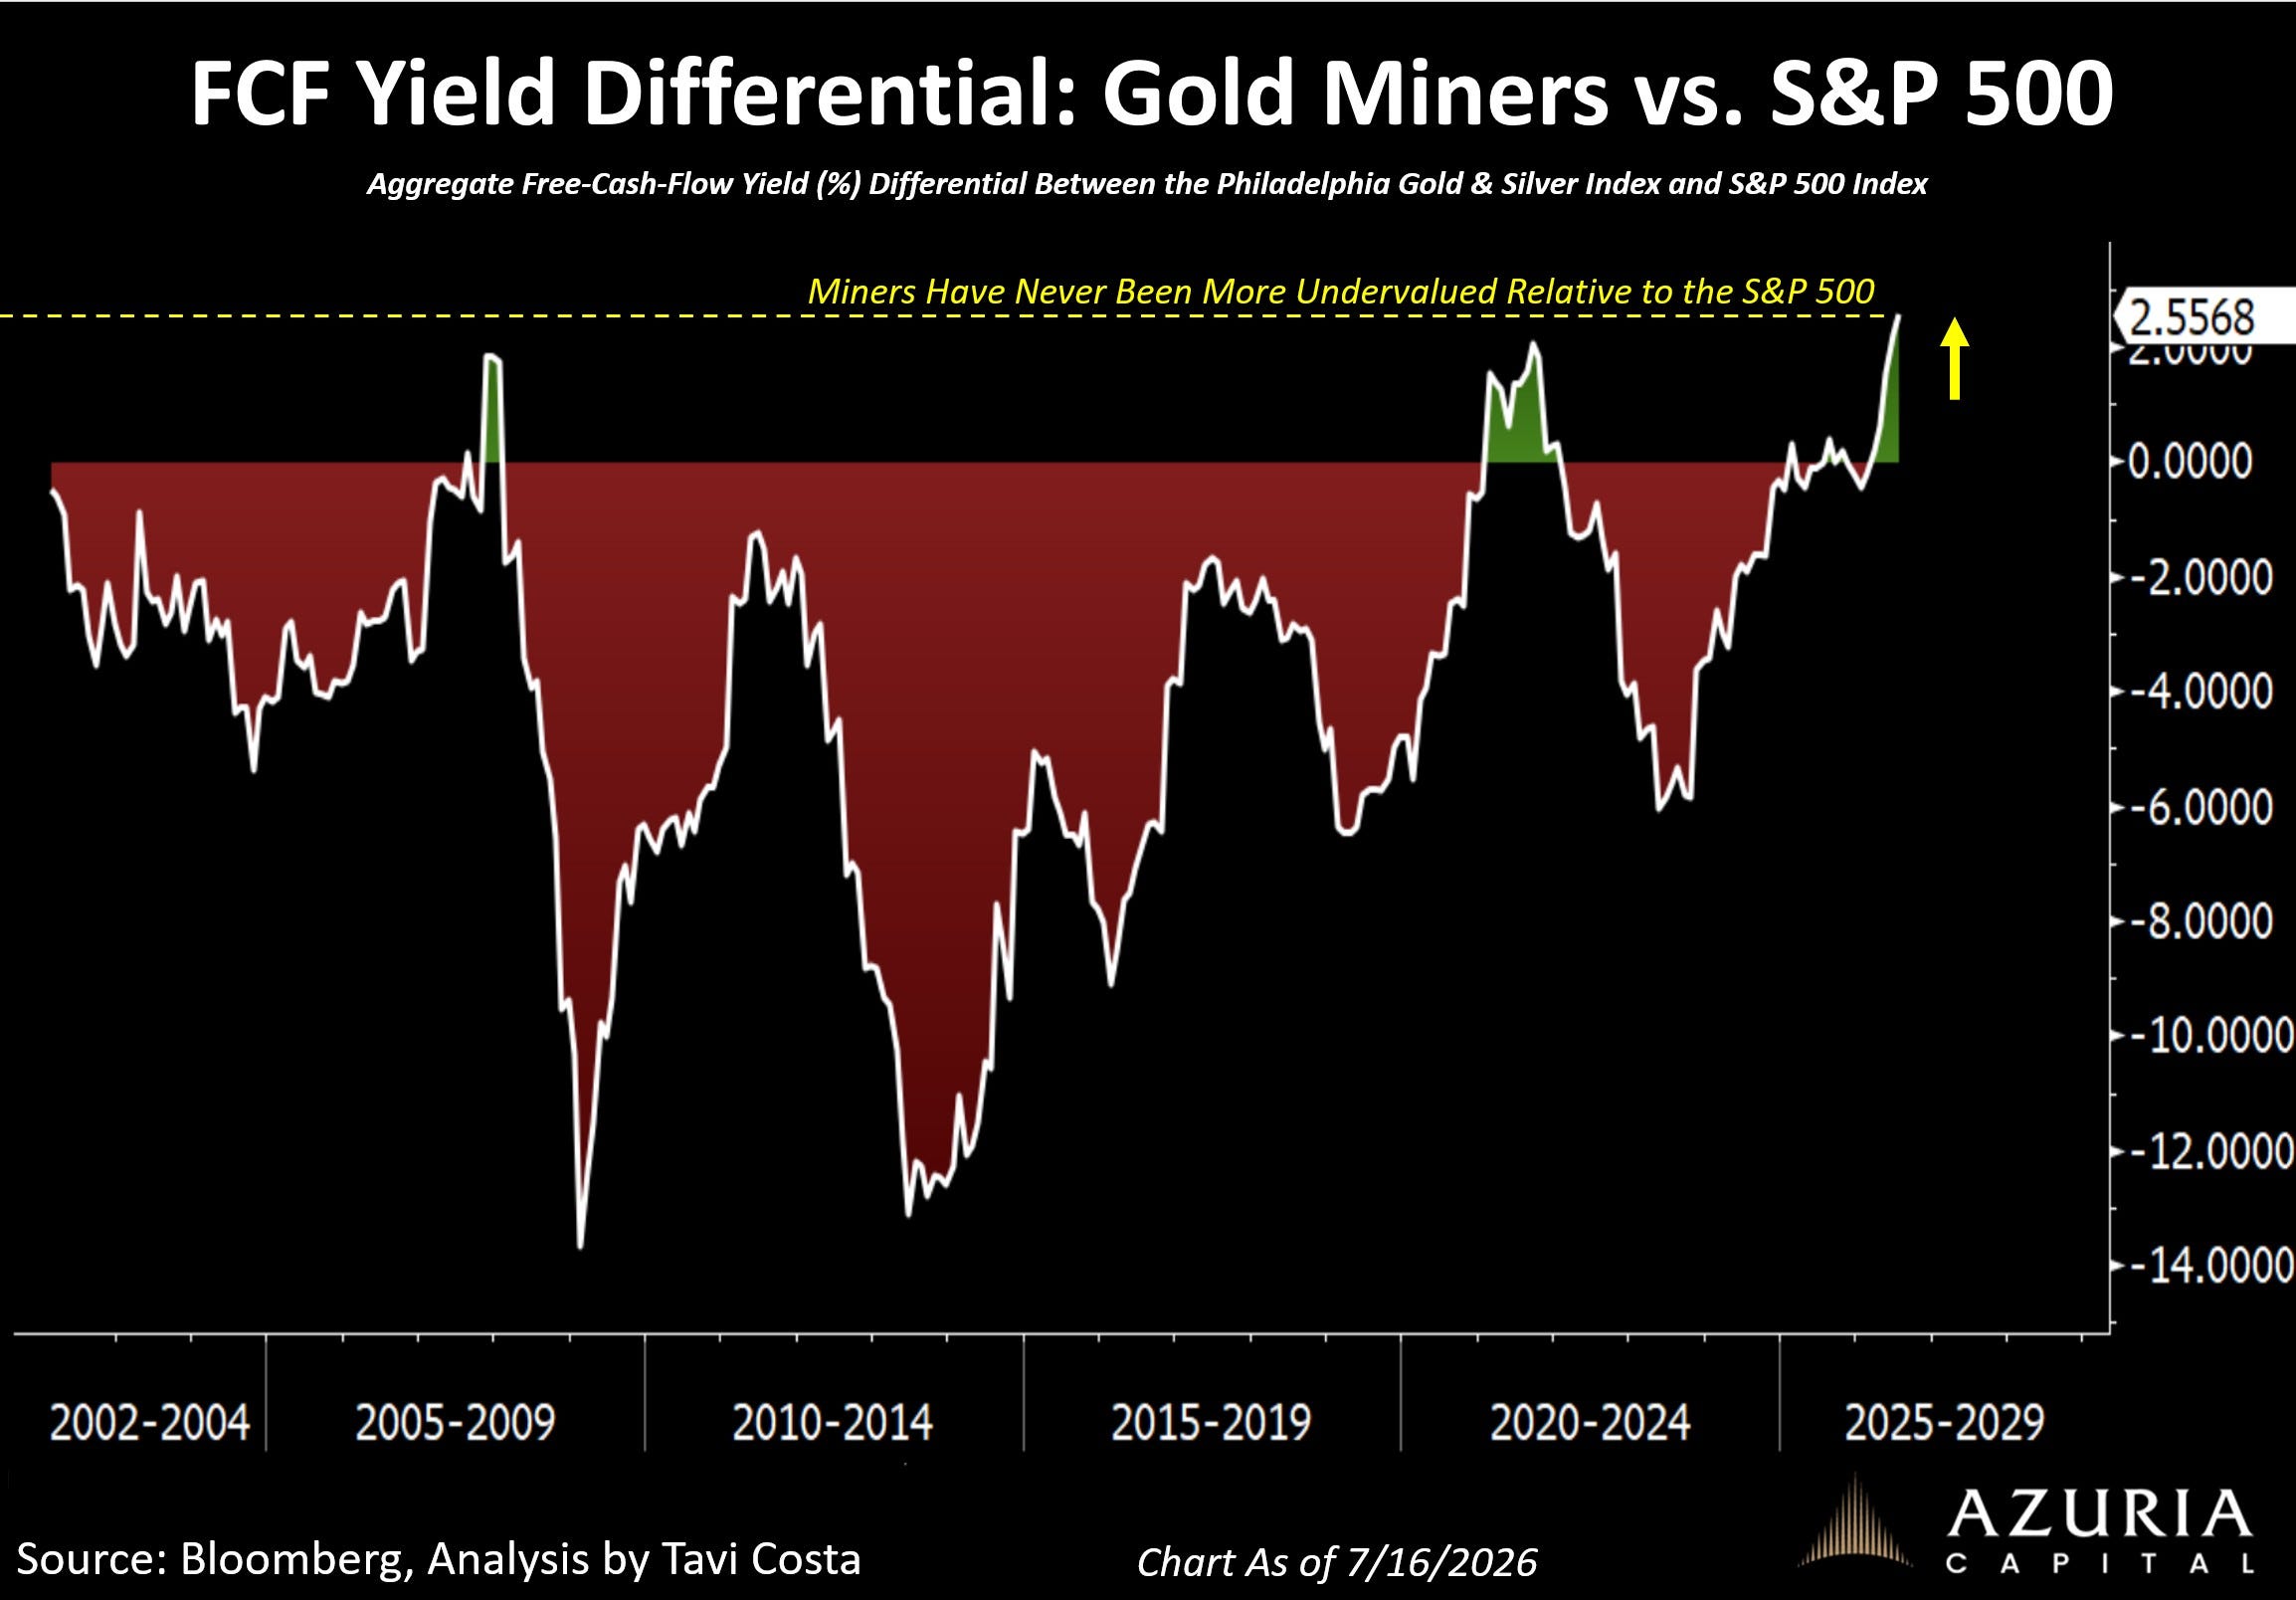
Gold miners have felt the love from higher gold prices, but still sit at a mere <1% of the stock market. They are the highest-margin sector right now and are at record undervaluation compared to the S&P 500 from a free cash flow yield perspective.
Conclusion
Not all commodities are equal. Wheat and copper have very different lead times for new production. They have also performed very differently over the past two years. While precious and industrial metals have stormed higher with exceptional returns, energy and agriculture are still completely hated sectors.
A record global oil disruption yet to be resolved has barely moved the oil price for a month. Agricultural commodities face potential impacts from geopolitical tensions and climatological impacts. These commodity sectors have still not moved in the same way as their metal counterparts, providing notable opportunity.
This is not to say commodities as a whole will not outperform in a lost decade scenario. We know that excessive money printing and devaluation of assets in real terms also helps scarce assets like commodities in addition to their underinvestment.
Instead of being collateral damage in a stock repricing, why not capture real returns in commodities when the AI bubble pops? Consider learning how I structure a portfolio to mitigate these risks while still outperforming the general market by upgrading your subscription to access the model portfolio.
-Grayson
Like to see these asymmetric opportunities synthesized into a real model portfolio that beats the S&P 500 and avoids major downside risks?
Socials
Twitter/X - @graysonhoteling
Email - thegrayarea55@gmail.com
Archive - The Gray Area
Notes - The Gray Area
Promotions
Sign up for TradingView
For educational and entertainment purposes only. The Gray Area should not be taken as financial advice.