
Fields of Neglect Pt. 2
Right now is typically the best investment opportunity for this unloved sector.

If you find this article interesting, click the like button for me! I would greatly appreciate it :)

In Fields of Neglect, I introduced three reasons why agricultural commodities could experience increased price volatility in the coming years. My case rests upon three grounds: macro, climate, and price technicals.
The prices of agricultural commodities are very low relative to their own history as well as relative to other assets like stocks and metals. On top of that, cash crops have fallen 50% from the 2022 levels. Finding cheap assets today is a challenge, but agriculture fits the bill.
The macro case centers around high oil prices and the fertilizer crisis. Not only do oil prices tend to lead moves in ag prices, but the oil inputs to fertilizer and the disruption are problematic and not retroactively fixed by the latest ceasefire agreement.
Climatologically, the solar cycle drives ENSO events (El Niño, La Niña), not to mention economic outcomes and human psychology discussed last week. Solar maximum drives El Niño, and the solar minimum drives La Niña, both with a roughly 1-3 year lag. September 2024 marked solar maximum, and last March I flagged the possibility for a strong El Niño before most realized. Now in June, the forecasts are even stronger than before. The median temperature anomaly prediction has been revised by a whole degree and a half higher since then. The median forecast now predicts a historic El Niño. Base forecasts are very strong, average in historic territory, and aggressive forecasts are in uncharted territory.

I have seen some analysts suggest that strong El Niños are bad for commodity prices, so let’s refine the analysis and look again at history. No one argues that there isn’t an impact, but researchers have had a hard time finding a general scientific consensus on solar cycles and commodity prices. There is a paper that shows increased price volatility from ENSO anomalies, plus ENSO anomalies have significant and dramatic impacts on global weather patterns.
Many analysts look at price movements during these times and discover poor correlations. The problem is that every period is not the same, and the context matters. There are many variables, and the starting point matters. Surely, an El Niño with expensive wheat prices will have worse returns than one with cheap wheat prices.
Wheat
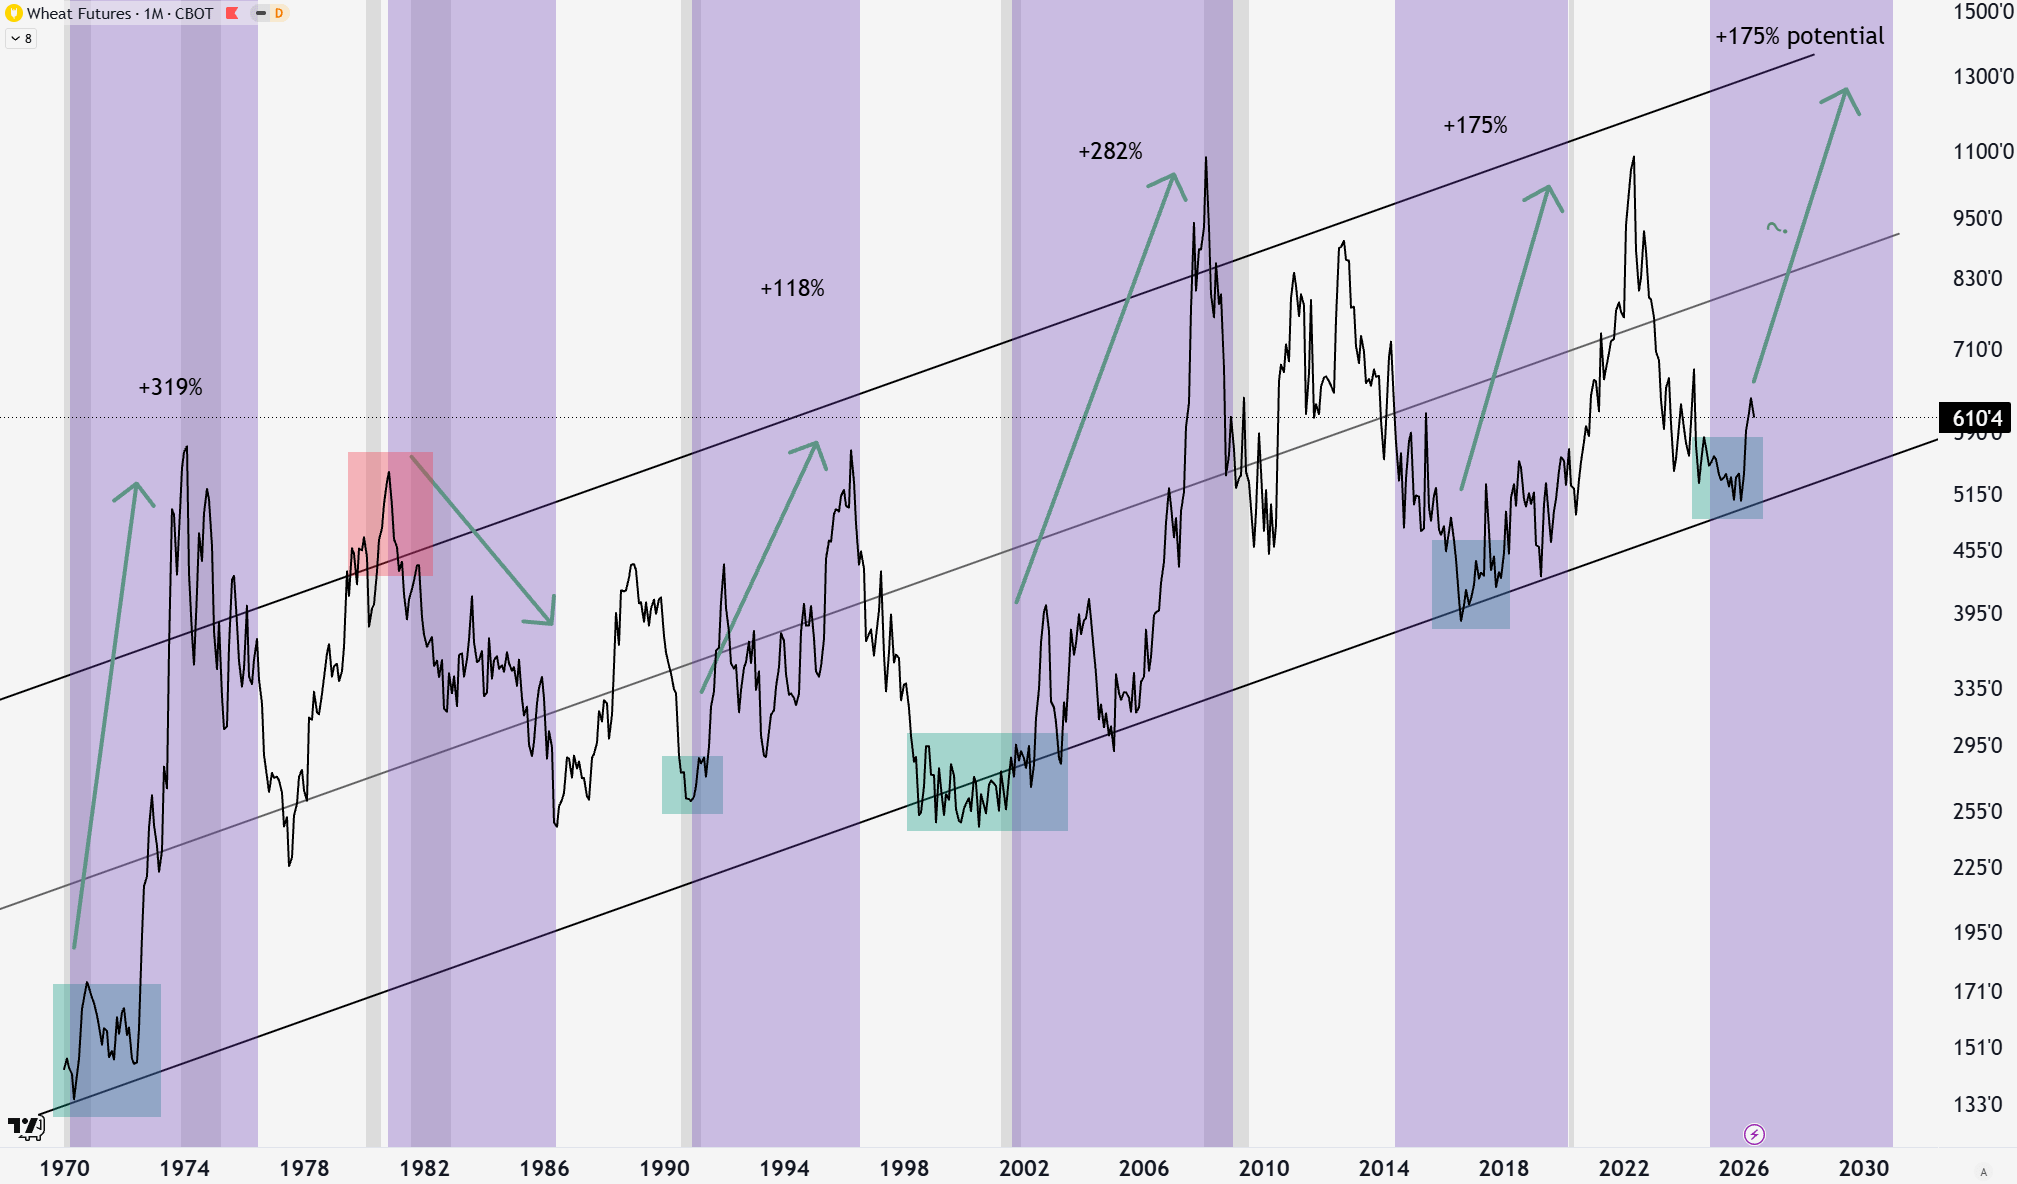
Instead of focusing on ENSO anomalies specifically, I will look at the declining phase of the solar cycle as a guide. This is the region where El Niños occur, and as we learned last week has much worse risk-adjusted stock returns. Entering the declining solar cycle phase from an oversold level tends to produce outsized returns for agricultural commodities.
Since 1970, there has only been one solar maximum where wheat had negative returns (1980). In 1980, wheat had just appreciated 143% and was above the long-term trendline in hindsight, but any reasonable person would agree this was a relatively expensive time to be holding wheat. Looking at the other declining solar phases, prices below the median line of the trend channel produced significant returns in the subsequent years. Four out of five periods going back to the 70s had this setup, and wheat prices at least doubled each time. We have the same setup now, with a +175% potential to the top of the trendline.
Sugar
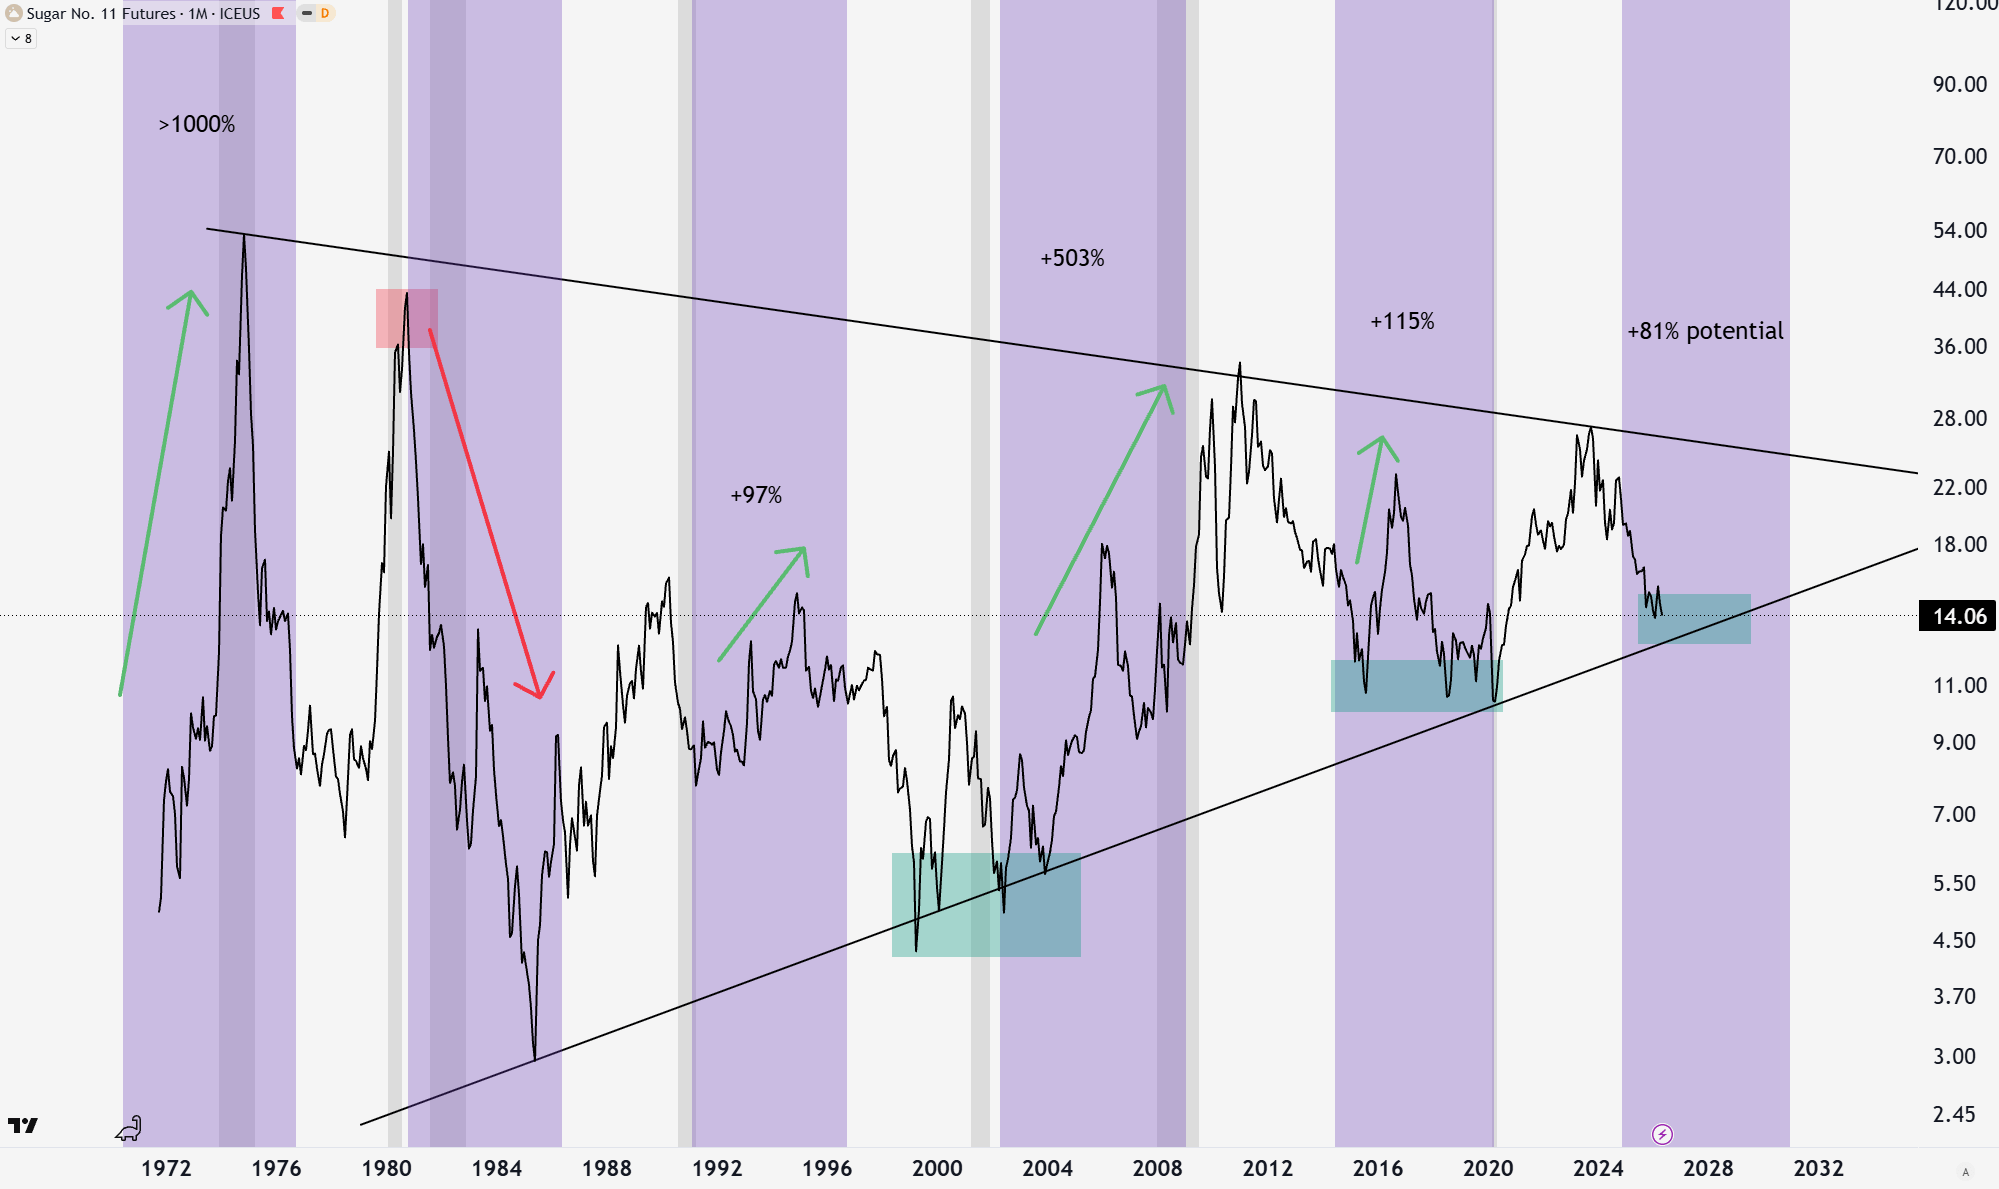
Sugar has a slightly different technical structure. It is not in a rising trend channel, but a rising wedge structure. The solar cycle analysis is the same. The declining phase post solar maximum is historically a great time to invest, assuming it is from an oversold basis. Price is near the bottom trendline now, with potential price appreciation of 81% to the top of the wedge. These wedges can break out in either direction, but often in the same direction as the trend, meaning the returns could be much higher if that plays out (even greater than 81%).
Corn
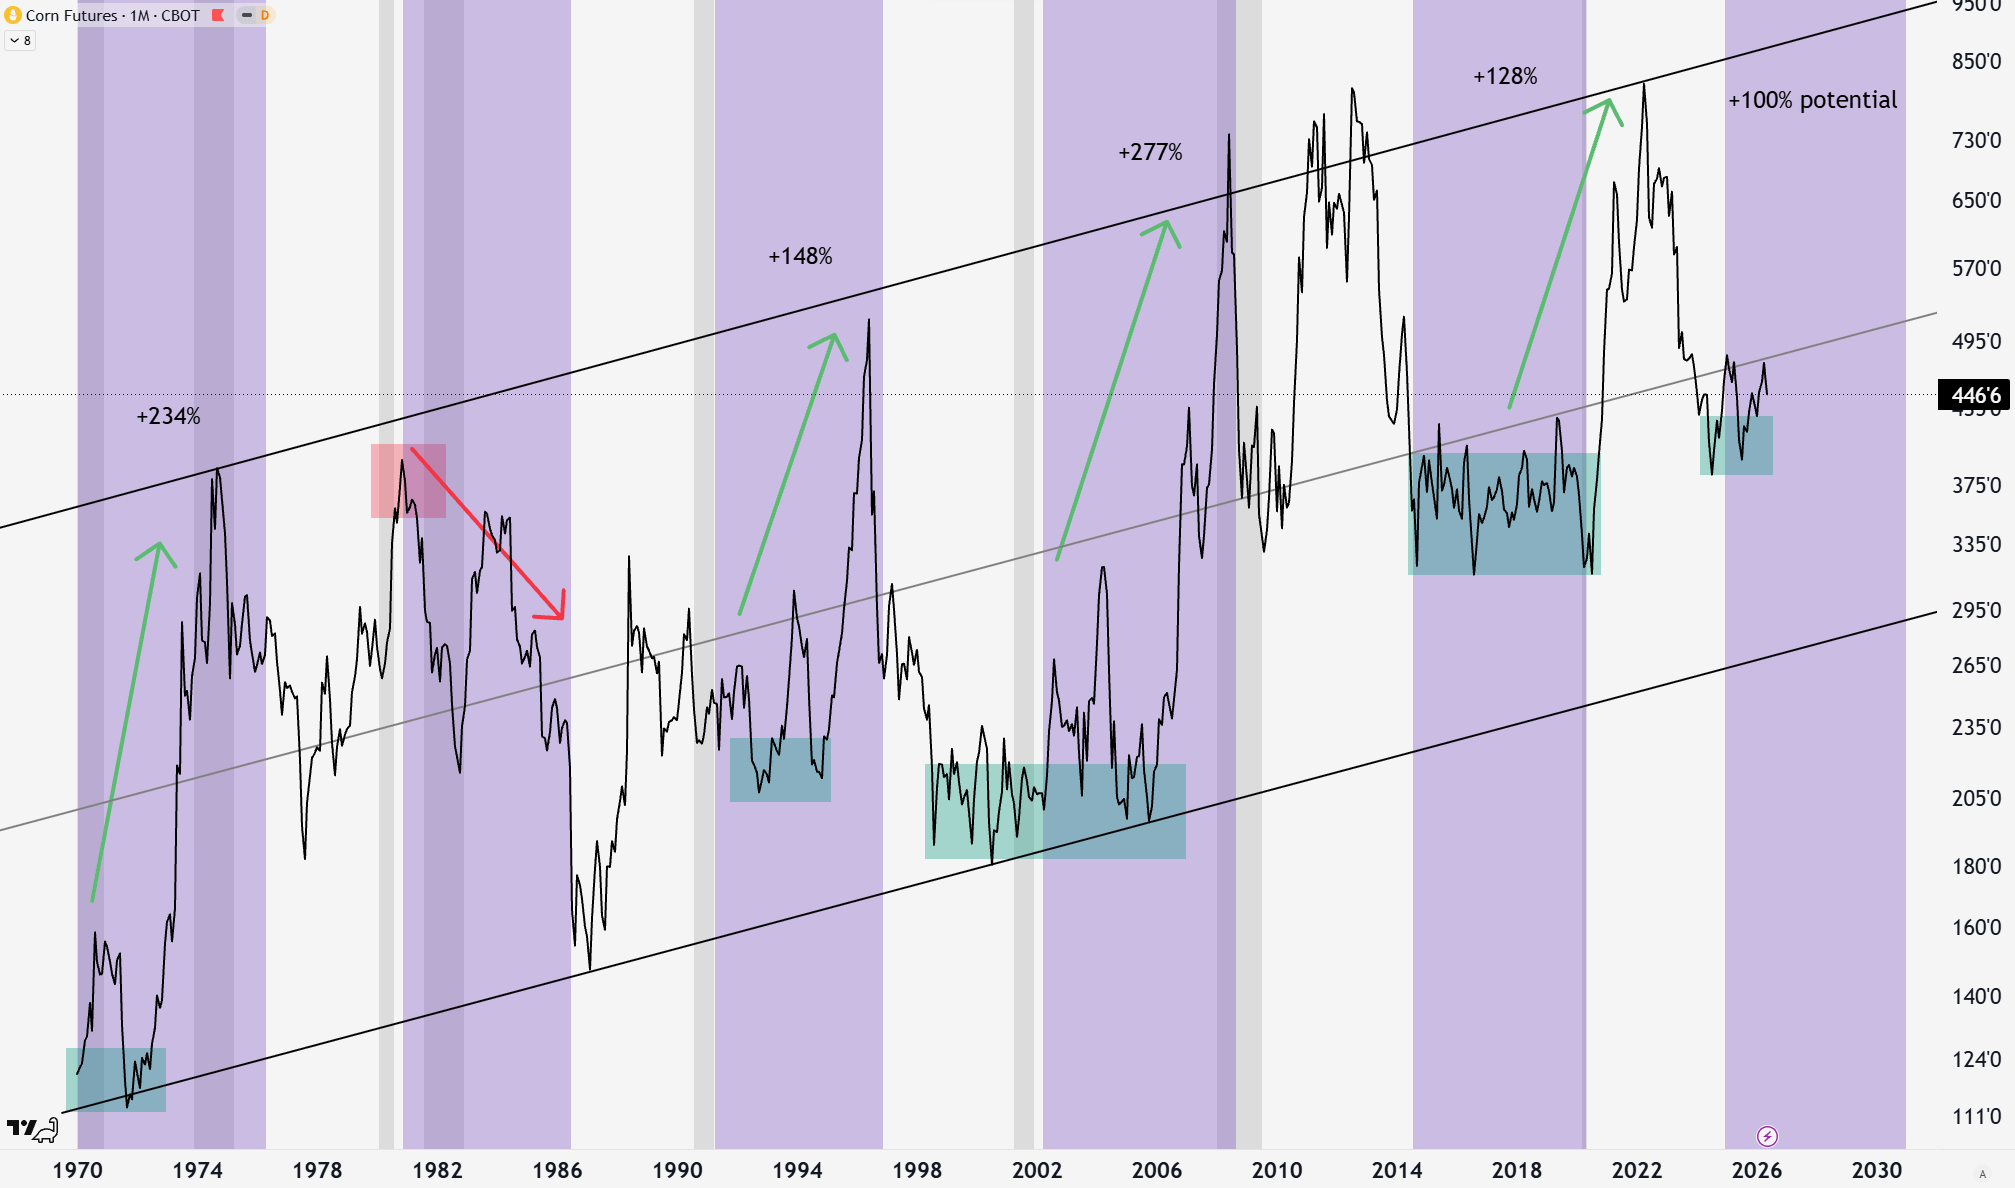
Corn is following a rising trend channel similar to wheat. Like its counterpart, buying cheap corn at solar maximum has produced incredible returns historically.
Soybeans
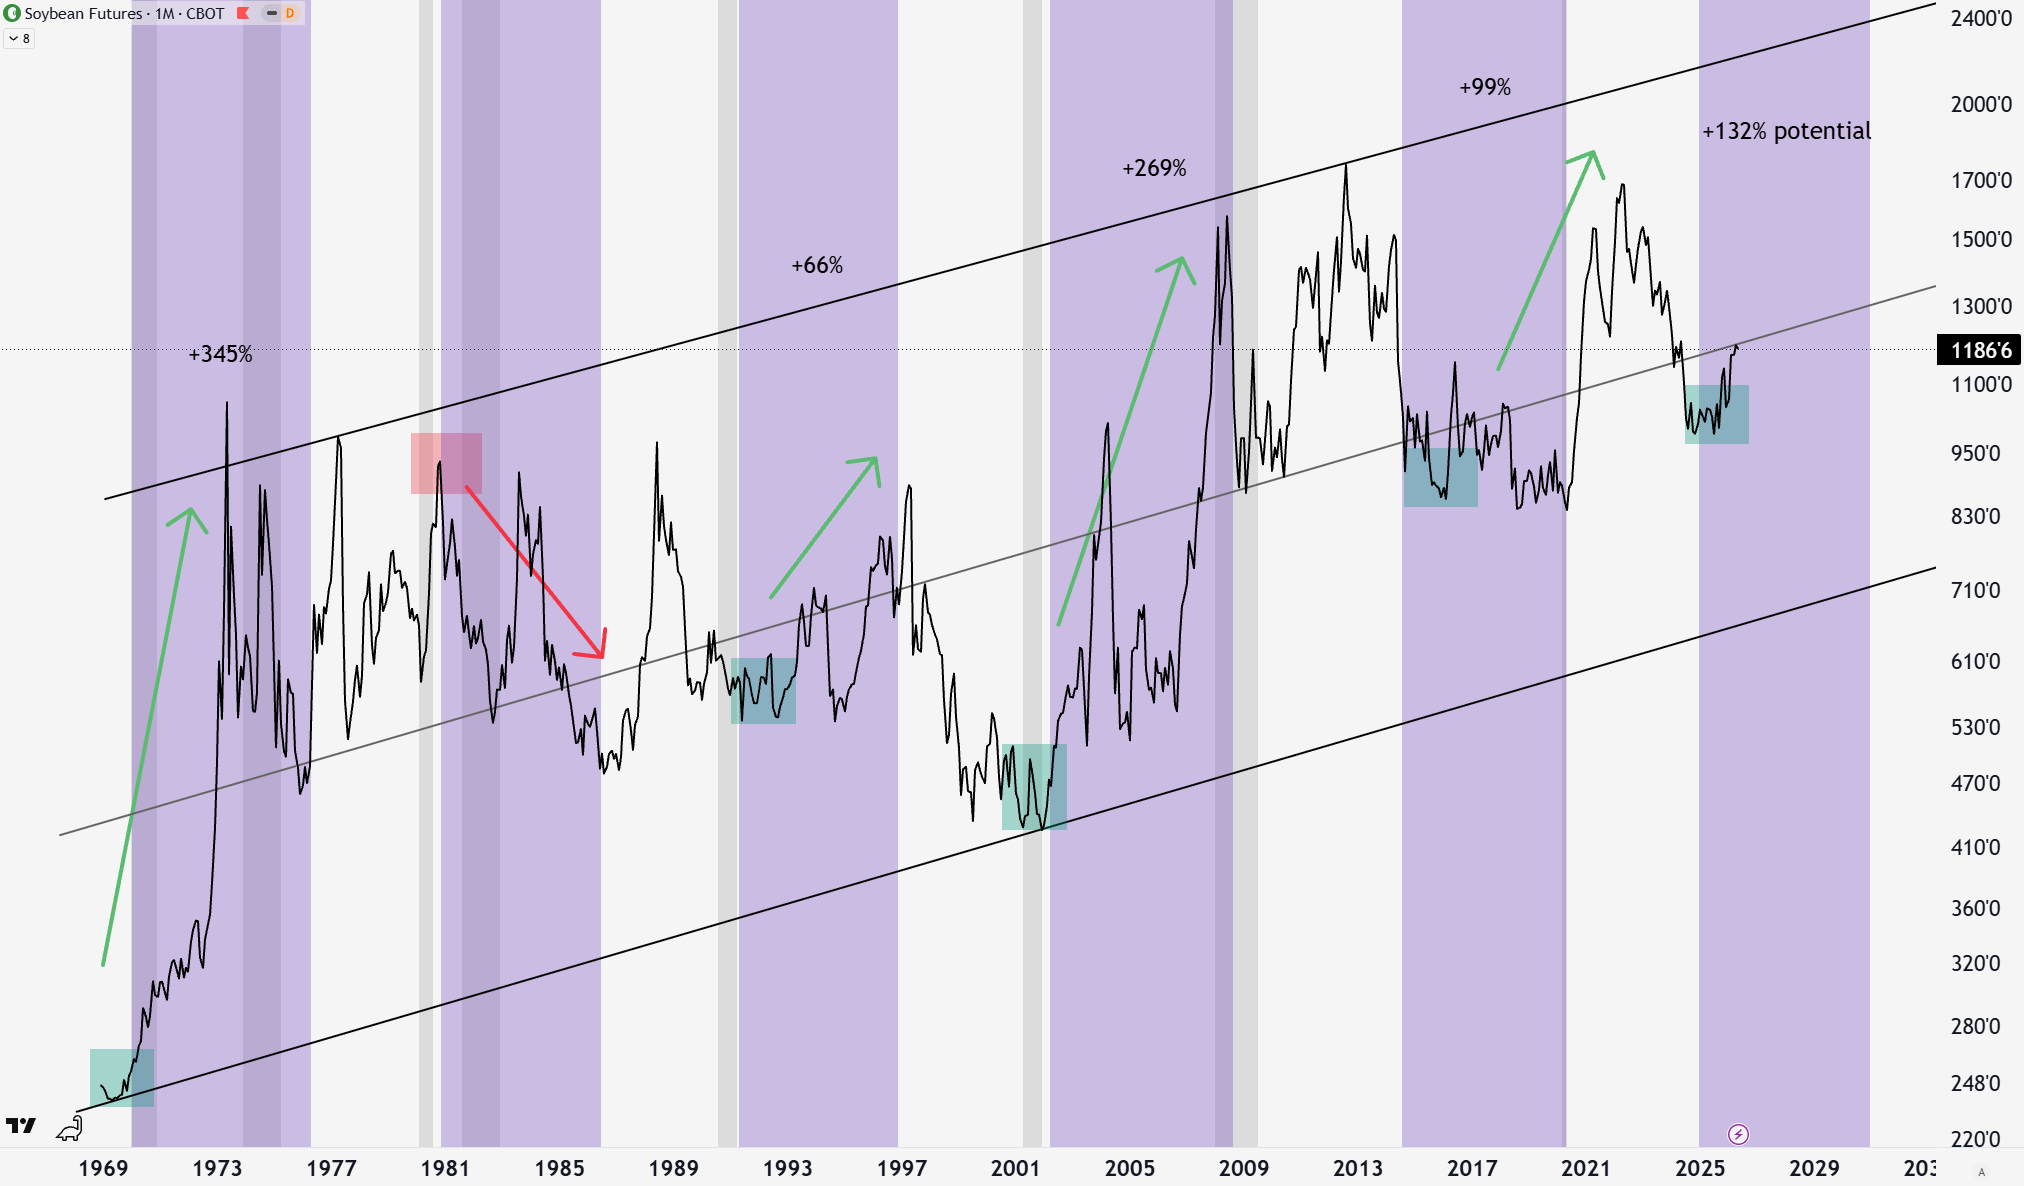
The last cash crop, soybeans, shows more of the same.
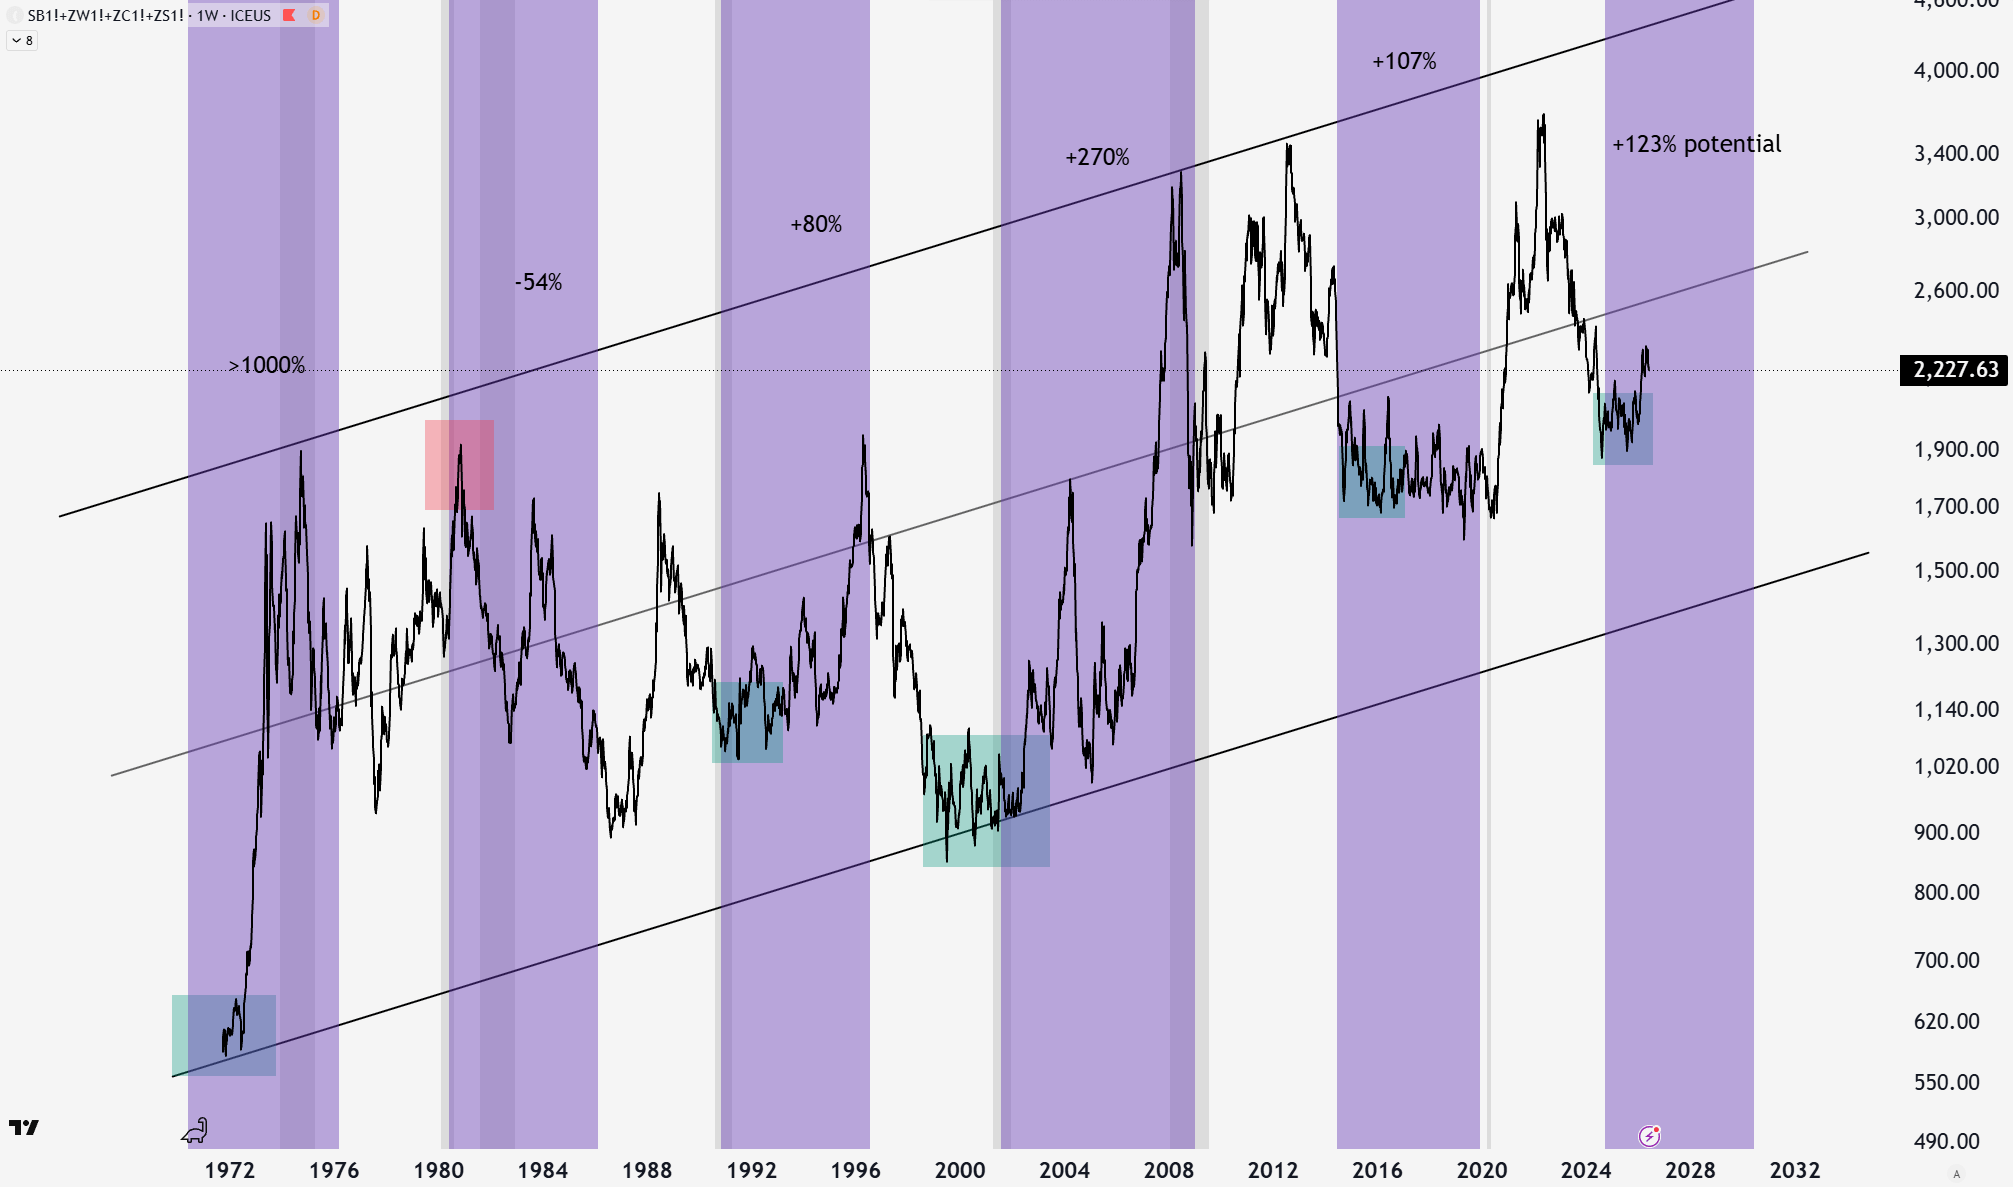
Cash Crops
Together, the picture is clear. Buying oversold cash crops during the declining solar cycle has been a great bet historically. Even in the 2016 period, when there was no immediate appreciation, the price essentially moved sideways before an eventual 107% move up.
There is room below current prices to correct to the bottom of the trendline, but the risk/reward is still promising. Plus, we can look at other asset classes as clues as well.
Cash Crops/S&P 500
While commodities essentially track inflation over time with tremendous volatility, stocks have earnings and growth. Naturally, the stock market will outperform over time. However, there are periods where this relationship shifts, and commodities outperform stocks.
Initially, looking below at the declining solar phase, you would conclude that most of the time, you are still better off owning stocks than cash crops. While true, this ignores the context, and we can’t simply ignore the times when that did not work, in case you get trapped in that period.
We have to look at the context and circumstances behind the phase where the cash crops outperformed. The late 1960s and 1990s were characterized by stock valuation extremes. The Nifty Fifty and dot-com bubble have names for a reason. Both of these instances resulted in a lost decade for stock market investors.
Instead of losing money during these times, or having cash inflated away, how about finding where money is made? Cash crops returned hundreds of percent returns during these time periods, where traditional investments in stocks and bonds lost money. We are at another valuation extreme today, which is even more extreme if you are skeptical of AI earnings. On top of that, we are coming off a nearly 50-year bond bull market with low interest rates and disinflation. These regimes may also be at a turning point. The point being, it is likely in my eyes that another period of commodity outperformance is in store.
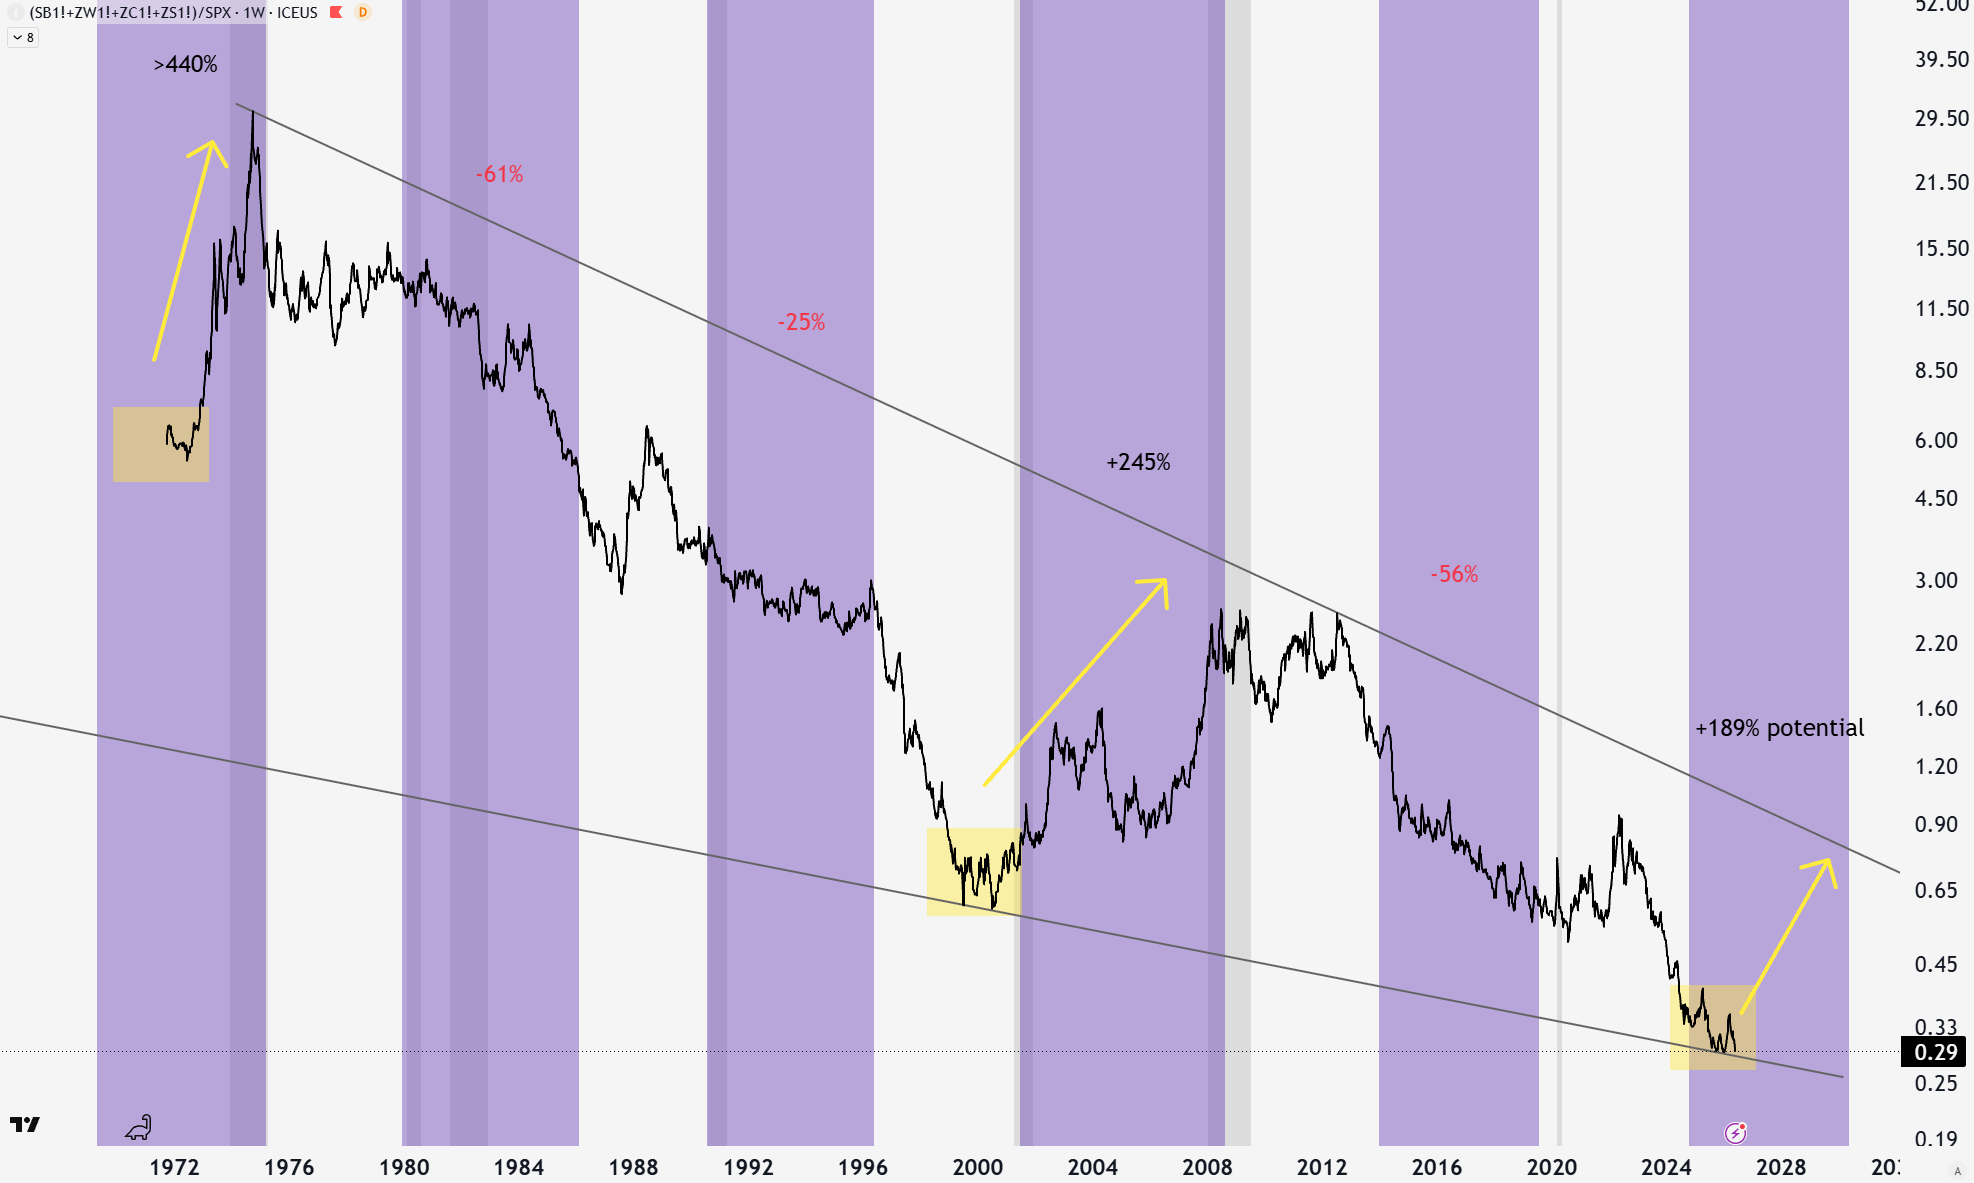
This brings us to now. We have a stock market bubble with low agricultural prices. From this perspective, agricultural commodities are a more attractive investment, with a 189% outperformance potential vs the S&P 500. We’ve seen this movie before, and true portfolio diversification is key. Don’t get caught up in the AI mania and invest to actually make money over the next 10+ years.
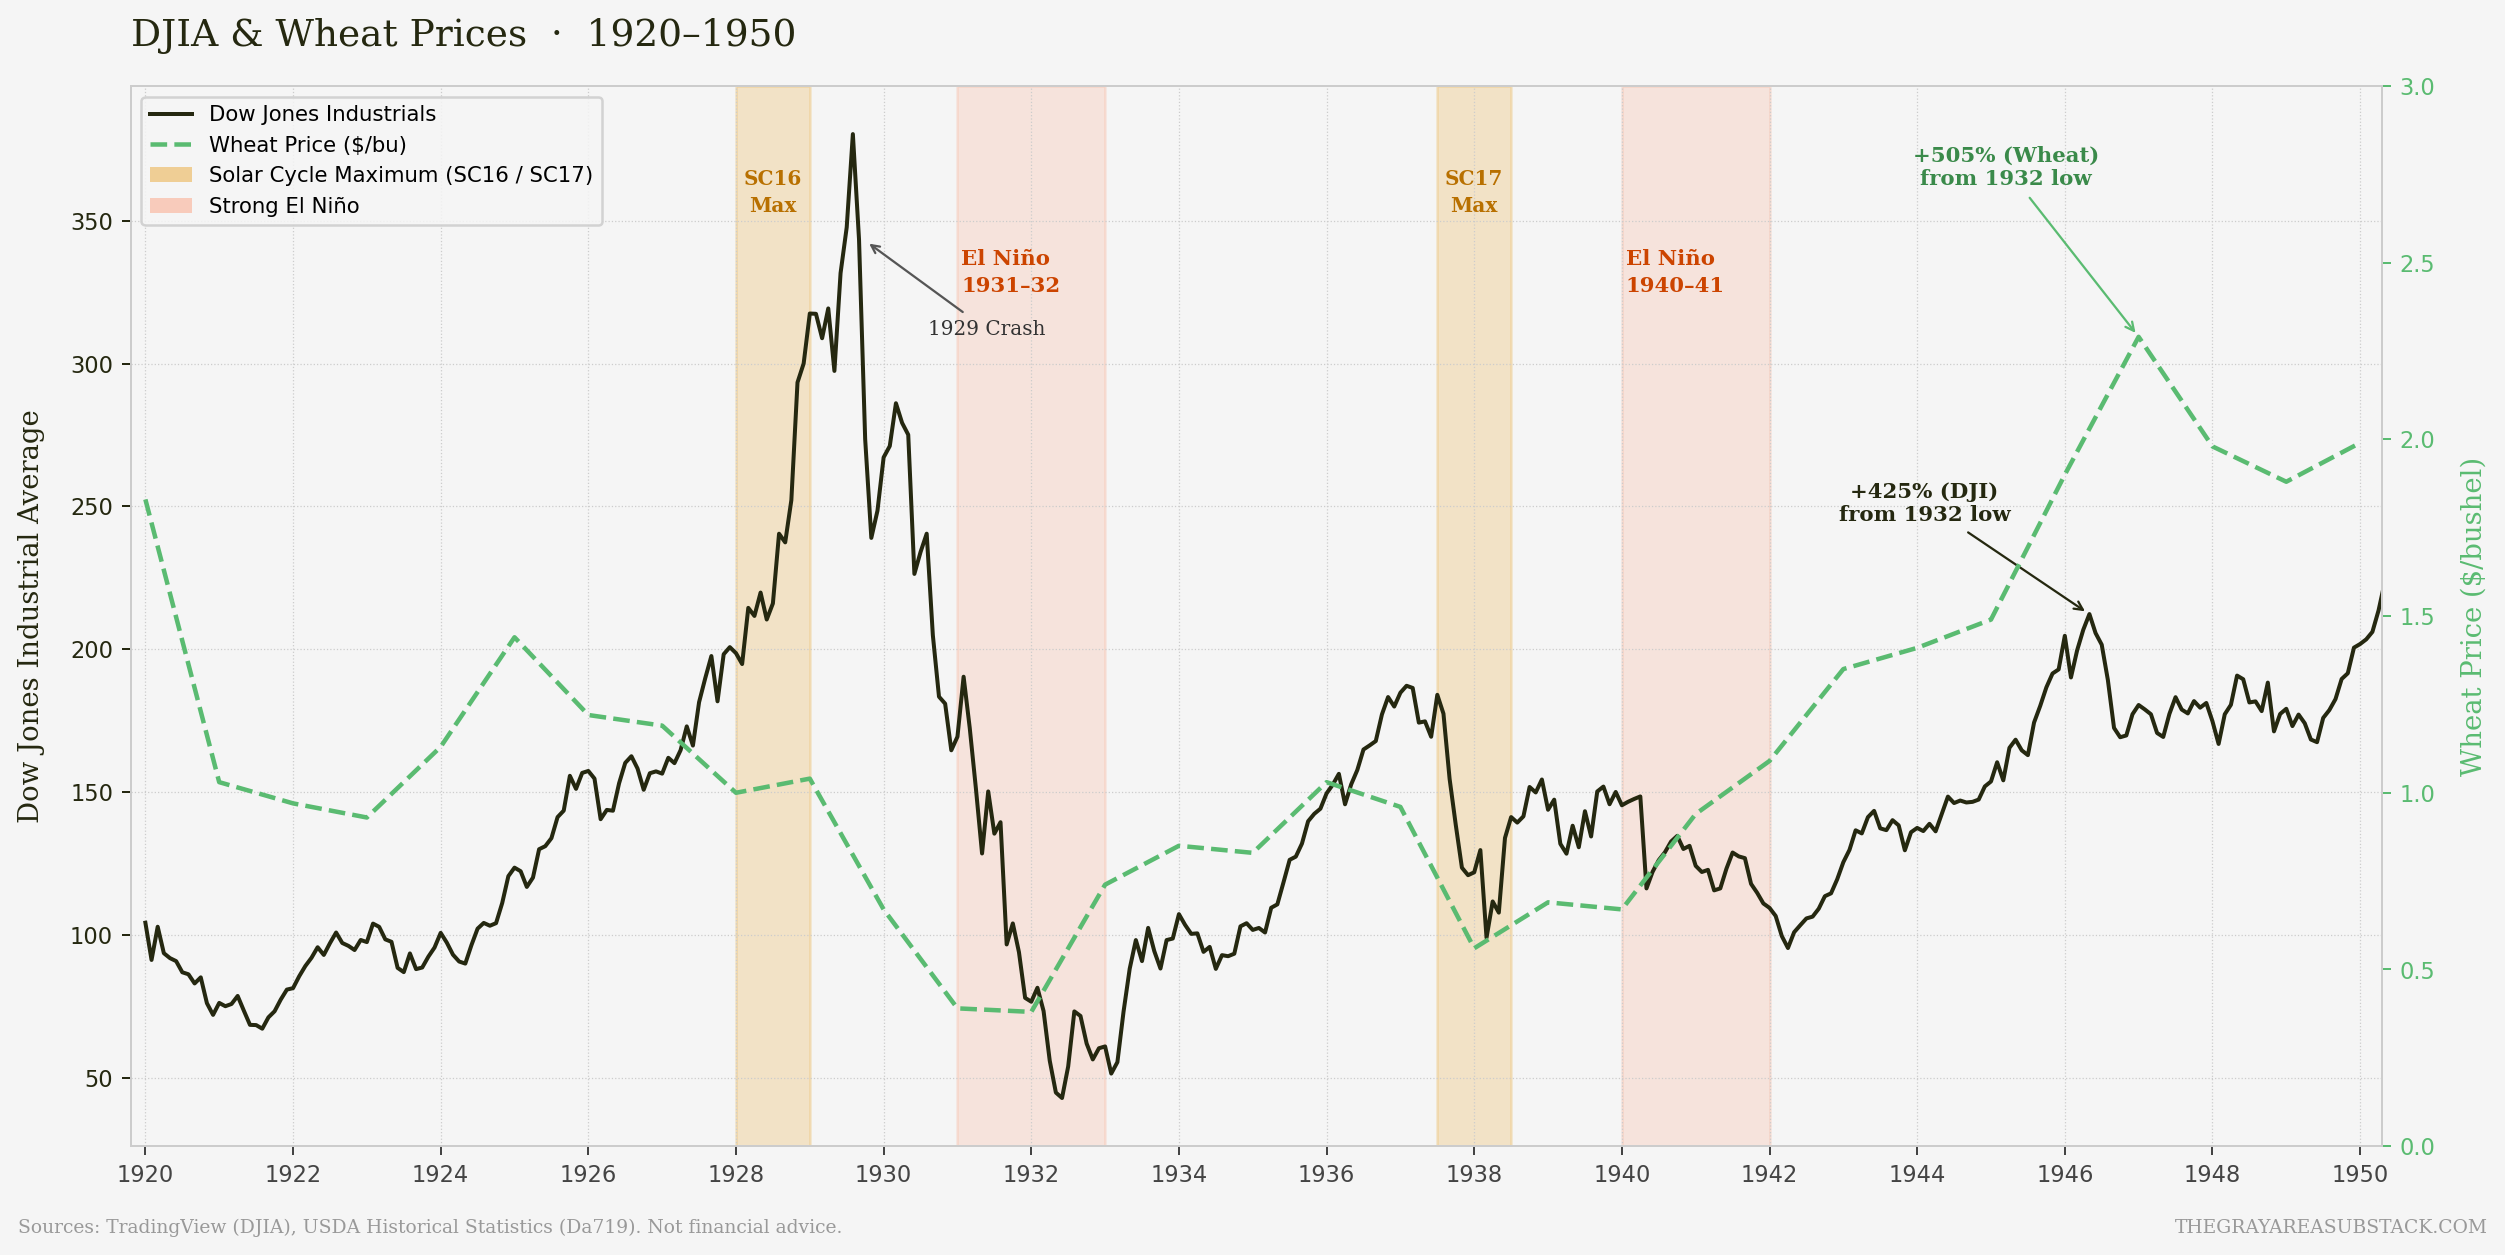
Great Depression
I wrote about the economics and returns during the last fourth turning in Tumultuous Times. This provides insight into the longer-term history before 1970. We are in a fourth turning now, meaning these time periods are genuinely comparable. The 1928 solar maximum was followed by a crash of all assets, including agriculture. Wheat held up better, though, falling only 50% while stocks fell 89%.
Then wheat bottomed before stocks and had better returns than stocks over the next 14 years. Then, the next solar maximum in 1938 marked the bottom in wheat prices, once again providing a promising investment opportunity.
Conclusion
We have a stock market bubble with historically cheap commodity prices. This is a recipe for a lost decade in which commodities have better historical returns than equities. The bubble could always continue for another few years, but the price and climate analysis show it is a good time for the cash crops regardless.
Most of the time, it is safe to follow the crowd. Every once in a while, the crowd gets trapped, and not everyone can escape at the same time. We are at a pivotal moment where it makes very little sense to remain in the crowd.
Want to preserve your wealth through retirement? Want to not derail your wealth building in a lost decade? Consider joining me in waking up and finding the areas where it actually makes sense to invest.
-Grayson
Like to see these asymmetric opportunities synthesized into a real model portfolio that beats the S&P 500 and avoids major downside risks?
Socials
Twitter/X - @graysonhoteling
Email - thegrayarea55@gmail.com
Archive - The Gray Area
Notes - The Gray Area
Promotions
Sign up for TradingView
For educational and entertainment purposes only. The Gray Area should not be taken as financial advice.
Excellent idea! Any favorite stocks or ETFs? Any advantage to stocks that issue a K-1 tax situation like DBA?